
Of those, many are oriented toward consumer/non-automotive use.
We are short $MVIS. In a market gone mad, this $1.2 billion market cap corporate husk with almost no revenue or intellectual property value is a standout.
It has risen 5,000% from lows this year on misguided retail euphoria over its LiDAR IP portfolio amid a broad EV bubble.
Of those, many are oriented toward consumer/non-automotive use.
“No one buys patents these days for any real money unless the patents have been put through the test of at least an IPR,” our IP attorney told us.
It was trading around $0.20 in April of this year and contemplating sale or liquidation.
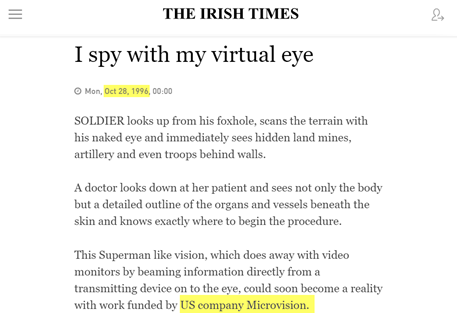
In November, the company put financing documents in place then announced the very next day that it hopes to have a LiDAR demo product by April 2021.
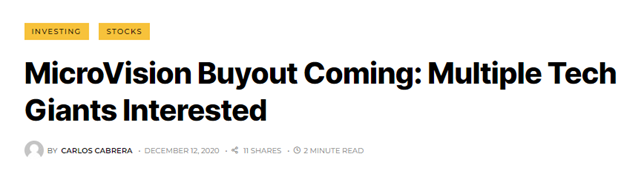
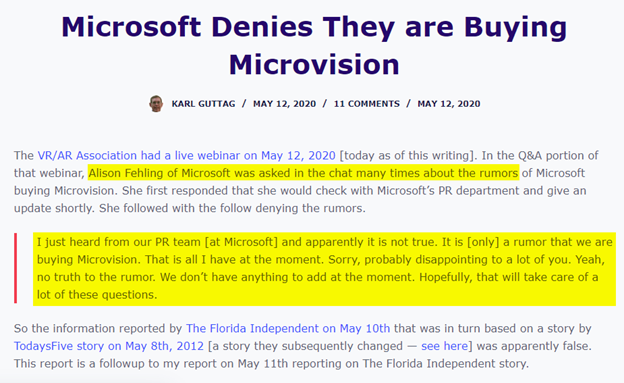
Regardless, these perpetual buyout rumors are a factor in the stock’s meteoric rise.
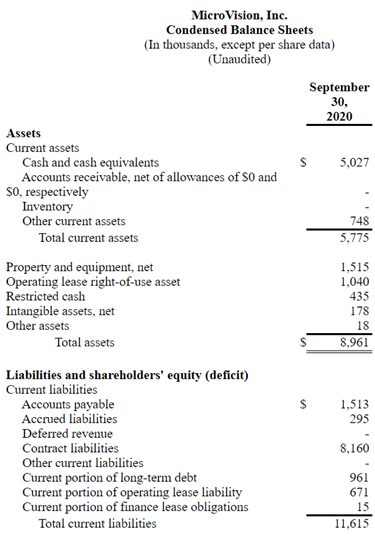
As of September 30, 2020, the company notes it has racked up an accumulated deficit of $582.7 million.
More from Trading








You May Also Like

The first area to focus on is diversity. This has become a dogma in the tech world, and despite the fact that tech is one of the most meritocratic industries in the world, there are constant efforts to promote diversity at the expense of fairness, merit and competency. Examples:
USC's Interactive Media & Games Division cancels all-star panel that included top-tier game developers who were invited to share their experiences with students. Why? Because there were no women on the
ElectronConf is a conf which chooses presenters based on blind auditions; the identity, gender, and race of the speaker is not known to the selection team. The results of that merit-based approach was an all-male panel. So they cancelled the conference.
Apple's head of diversity (a black woman) got in trouble for promoting a vision of diversity that is at odds with contemporary progressive dogma. (She left the company shortly after this
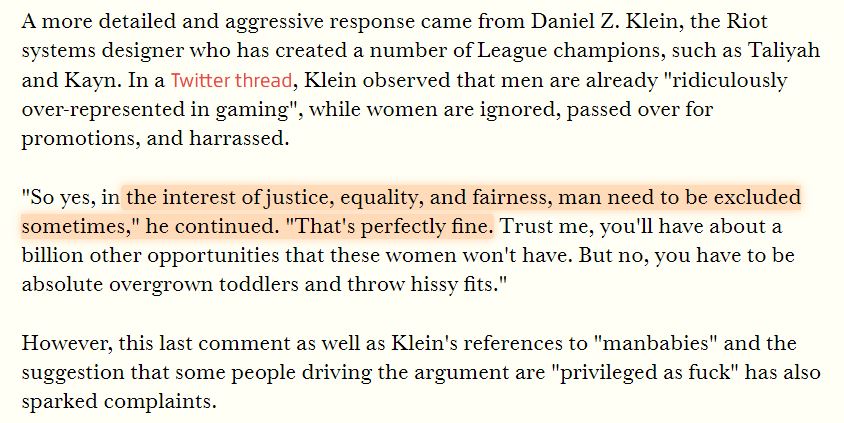
Also in the name of diversity, there is unabashed discrimination against men (especially white men) in tech, in both hiring policies and in other arenas. One such example is this, a developer workshop that specifically excluded men: https://t.co/N0SkH4hR35
USC's Interactive Media & Games Division cancels all-star panel that included top-tier game developers who were invited to share their experiences with students. Why? Because there were no women on the
ElectronConf is a conf which chooses presenters based on blind auditions; the identity, gender, and race of the speaker is not known to the selection team. The results of that merit-based approach was an all-male panel. So they cancelled the conference.
Apple's head of diversity (a black woman) got in trouble for promoting a vision of diversity that is at odds with contemporary progressive dogma. (She left the company shortly after this
Also in the name of diversity, there is unabashed discrimination against men (especially white men) in tech, in both hiring policies and in other arenas. One such example is this, a developer workshop that specifically excluded men: https://t.co/N0SkH4hR35











First update to https://t.co/lDdqjtKTZL since the challenge ended – Medium links!! Go add your Medium profile now 👀📝 (thanks @diannamallen for the suggestion 😁)

Just added Telegram links to https://t.co/lDdqjtKTZL too! Now you can provide a nice easy way for people to message you :)

Less than 1 hour since I started adding stuff to https://t.co/lDdqjtKTZL again, and profile pages are now responsive!!! 🥳 Check it out -> https://t.co/fVkEL4fu0L
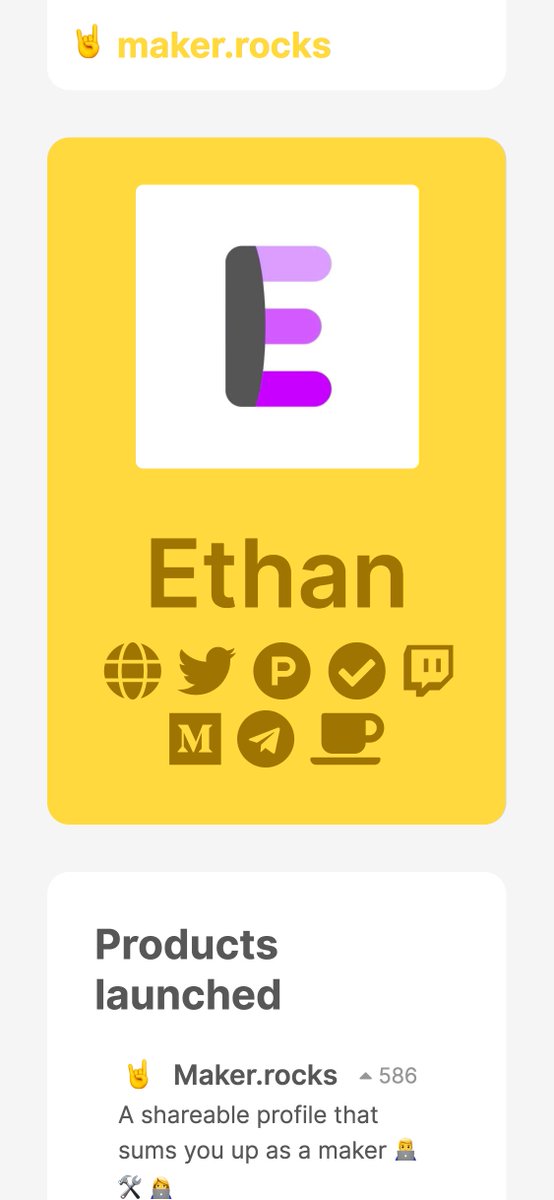
Accounts page is now also responsive!! 📱✨
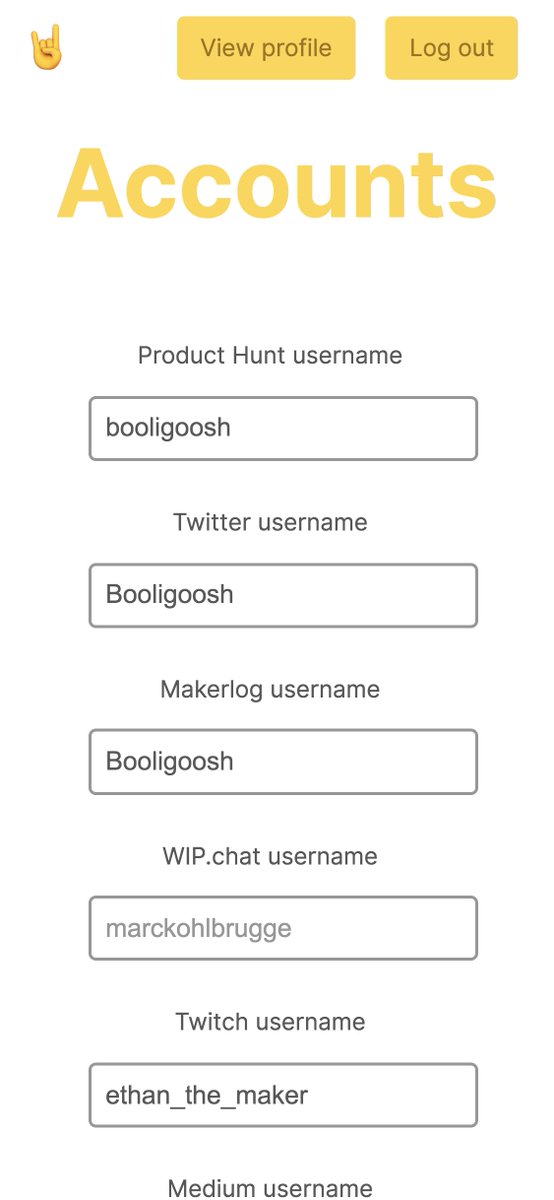
💪 I managed to make the whole site responsive in about an hour. On my roadmap I had it down as 4-5 hours!!! 🤘🤠🤘
Just added Telegram links to https://t.co/lDdqjtKTZL too! Now you can provide a nice easy way for people to message you :)
Less than 1 hour since I started adding stuff to https://t.co/lDdqjtKTZL again, and profile pages are now responsive!!! 🥳 Check it out -> https://t.co/fVkEL4fu0L
Accounts page is now also responsive!! 📱✨
💪 I managed to make the whole site responsive in about an hour. On my roadmap I had it down as 4-5 hours!!! 🤘🤠🤘