Let us think about creating an indicator that shows the trend.
Thread: Parabolic SAR Indicator
Parabolic SAR (PSAR) indicator was developed by J. Welles Wilder.
#PSAR #Indicators #Definedge
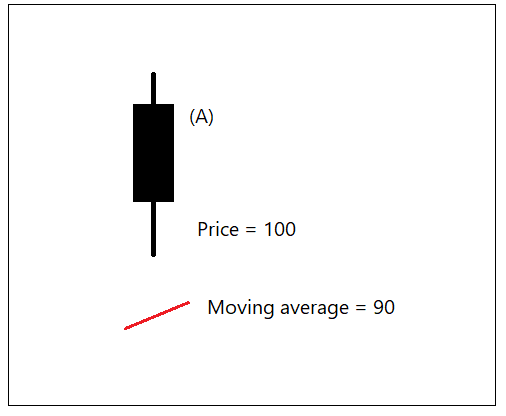
Let us think about creating an indicator that shows the trend.
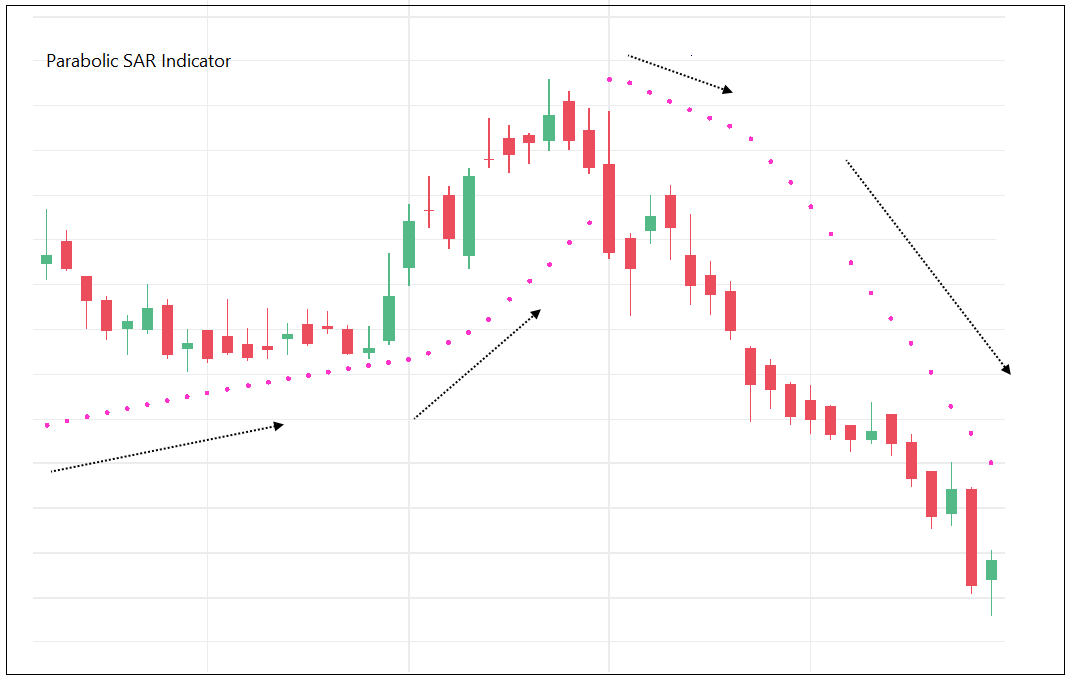
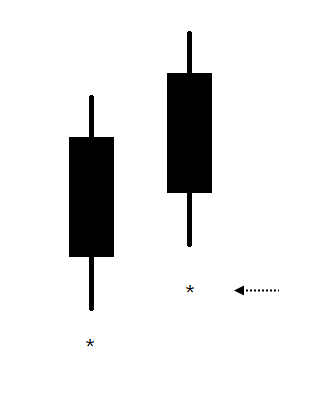
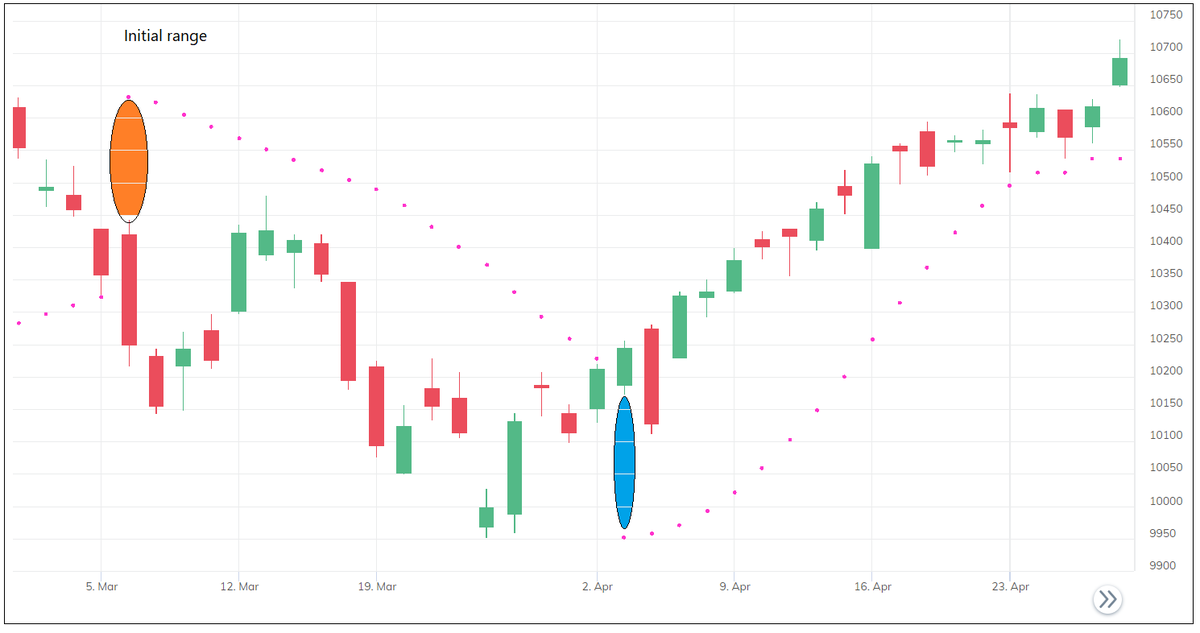
For trailing the stop in uptrend, indicator needs to be placed below the candle. Similarly, it should be placed above the candle for trailing in a downtrend. We will plot it using ‘dots’.
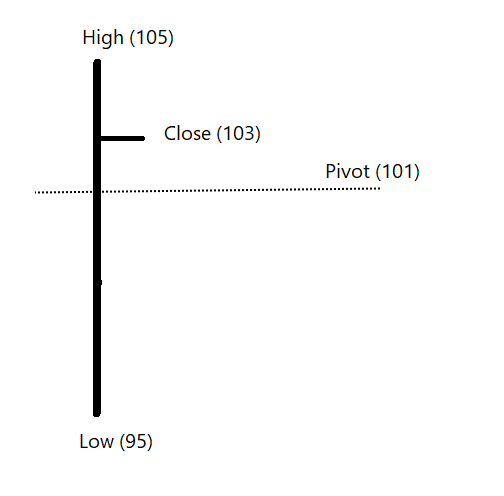
Let us define the trend as:
If Low of the candle > Stop-loss level in bull market = Trend remains bullish.
If High of the candle < Stop-loss level in bear market = Trend is bearish

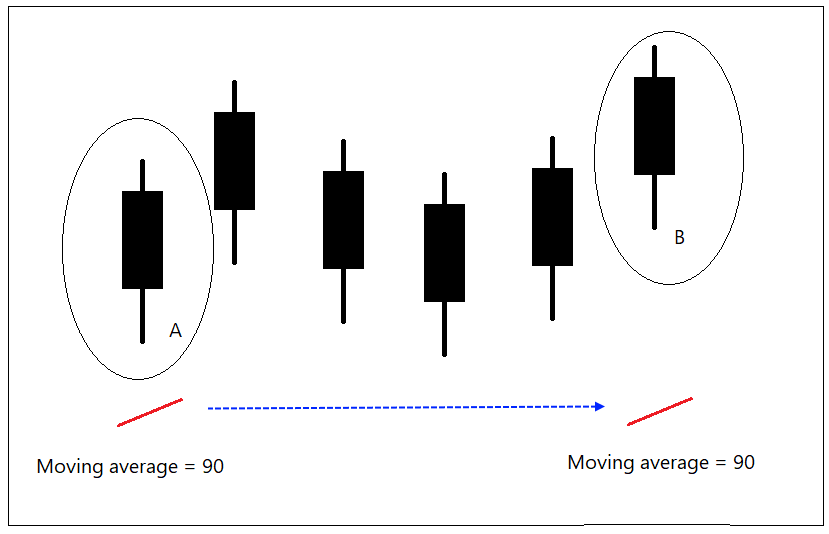
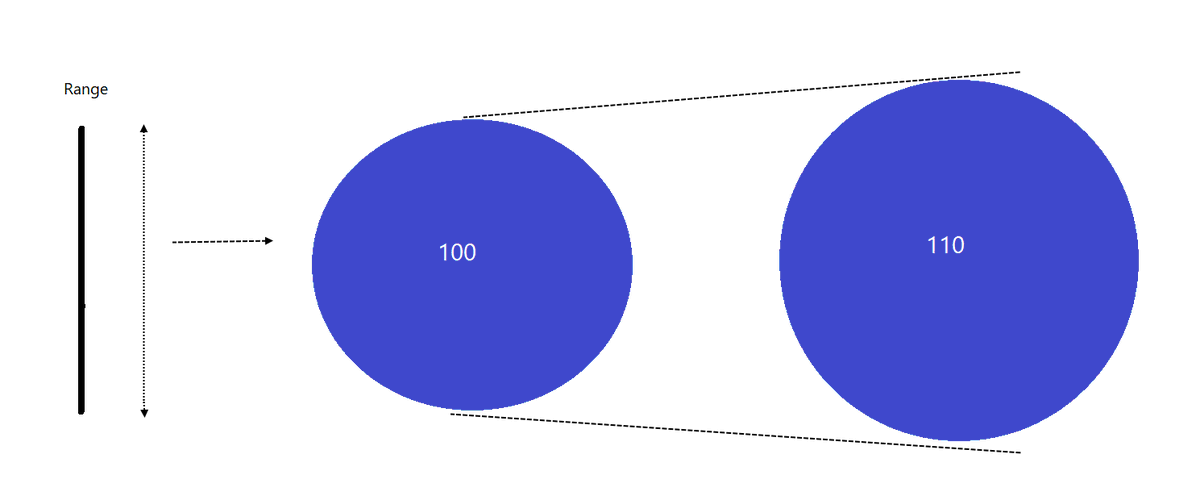
The indicator rises steadily if the trend is steady. If the trend is strong the indicator should accelerate, it should move faster and stop should get trailed aggressively.
What is strong trend?
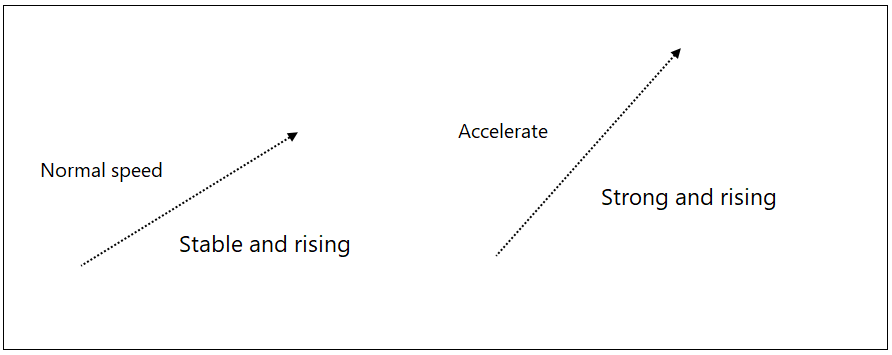
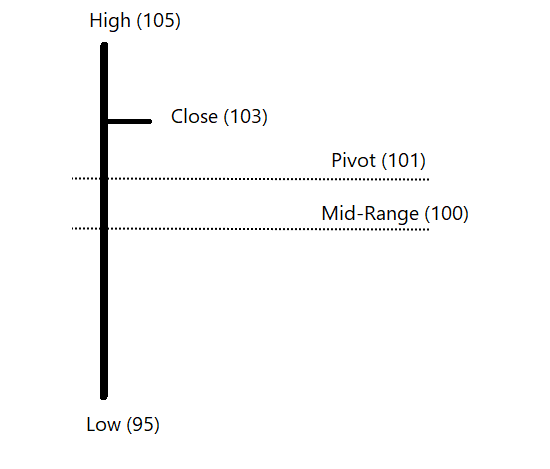
In a bullish trend if price makes a new high it is a strong bullish trend.
In a bearish trend, if price makes a new low it is a strong bearish trend.
Period?
Period for new high: since the indicator turned bullish
Period for new low: since the indicator turned bearish
Calculation of PSAR: EP, AF and PSAR
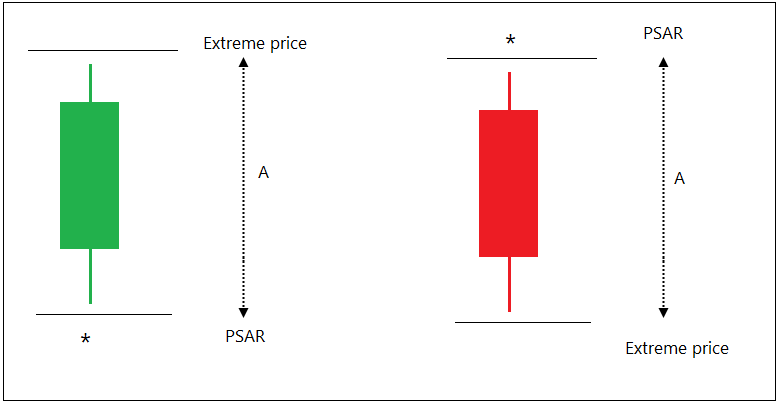
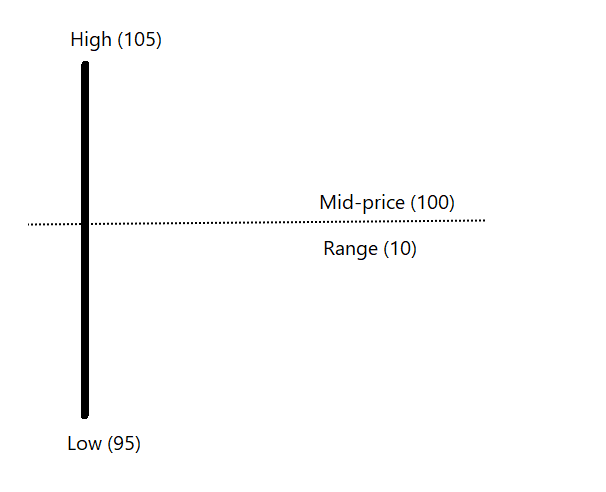
Extreme Price (EP) is calculated on every candle.
‘High’ price in bullish market and ‘Low’ price in bearish market is called as Extreme Price (EP).
If new high is made -> EP = New High price
Else
EP = Prev High
If Bearish trend
If new low is made -> EP = New Low price
Else
EP = Prev Low
Period of new high or low is explained earlier.
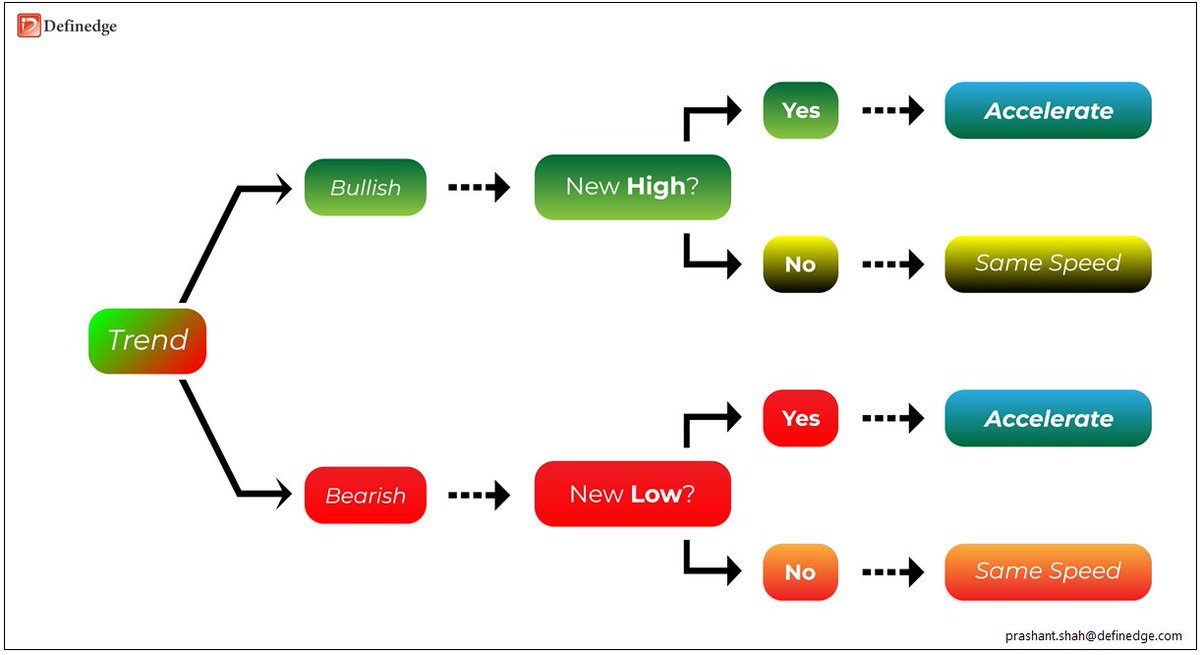
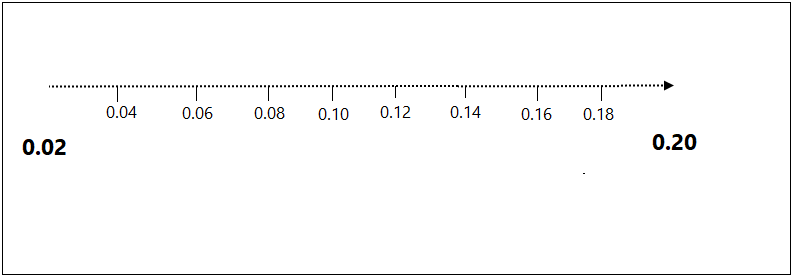
> Accelerate it by 0.02 if trend is steady.
> Add 0.02 to previous speed if trend is strong.
> Maximum acceleration will be 0.20.
Multiply Acceleration factor by A and add it to the previous stop-loss, you get new PSAR indicator reading.
PSAR = A x AF + Previous PSAR reading
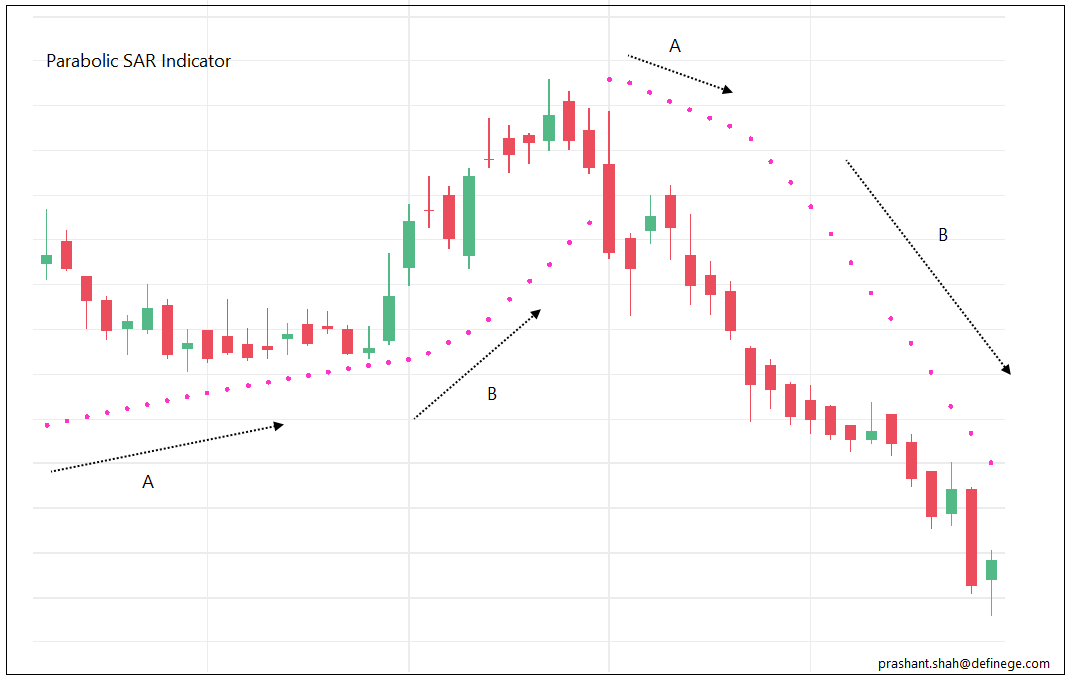
Phase A is when indicator moving at a steady speed. Phase B is when trend is strong (New high in bull market, new low in bear market) hence, PSAR is accelerating with a greater speed (0.02 being added) during B.
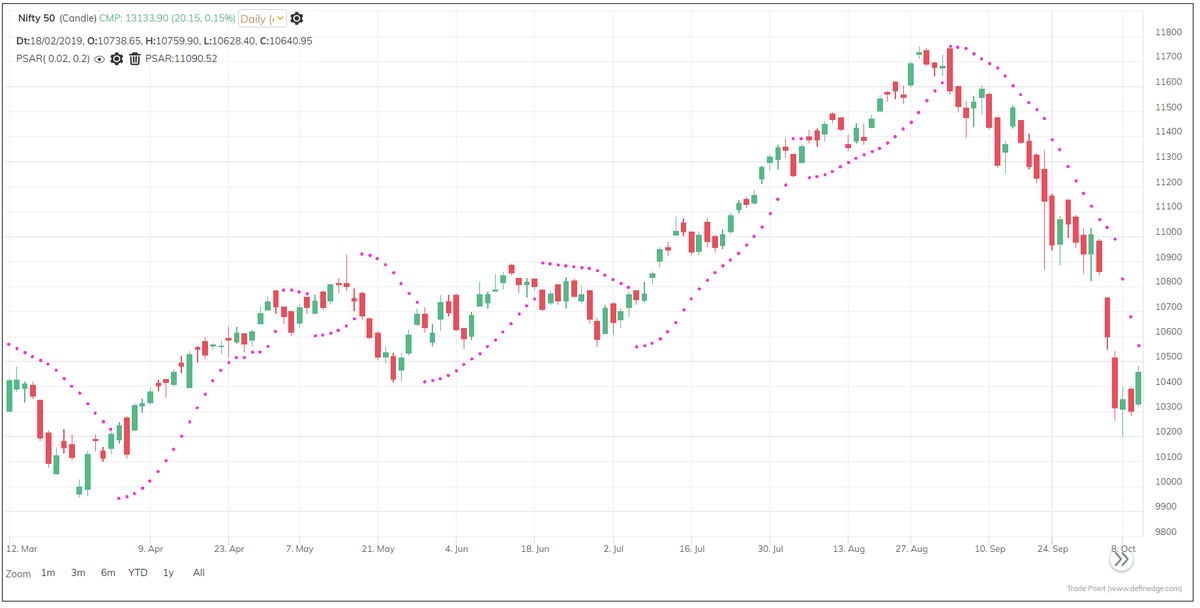
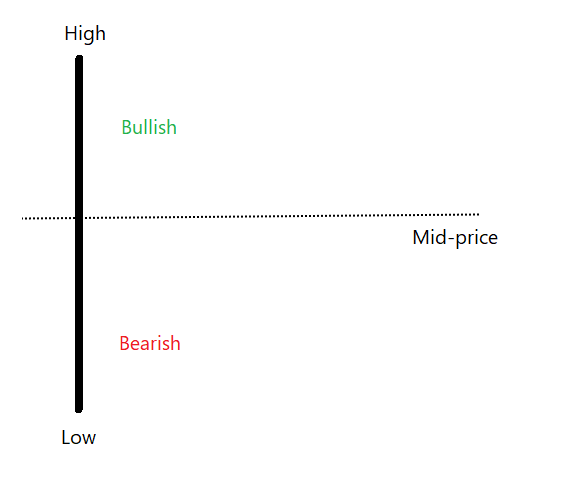
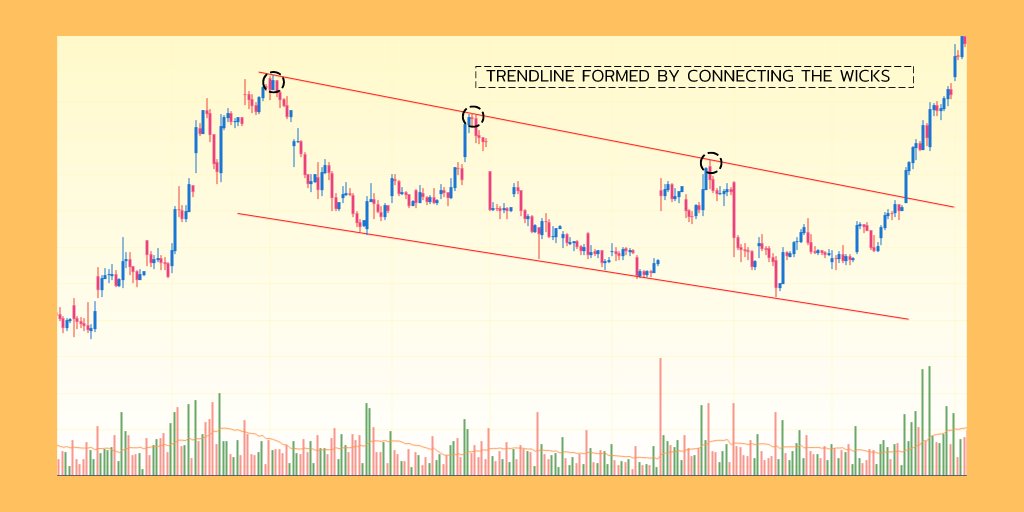
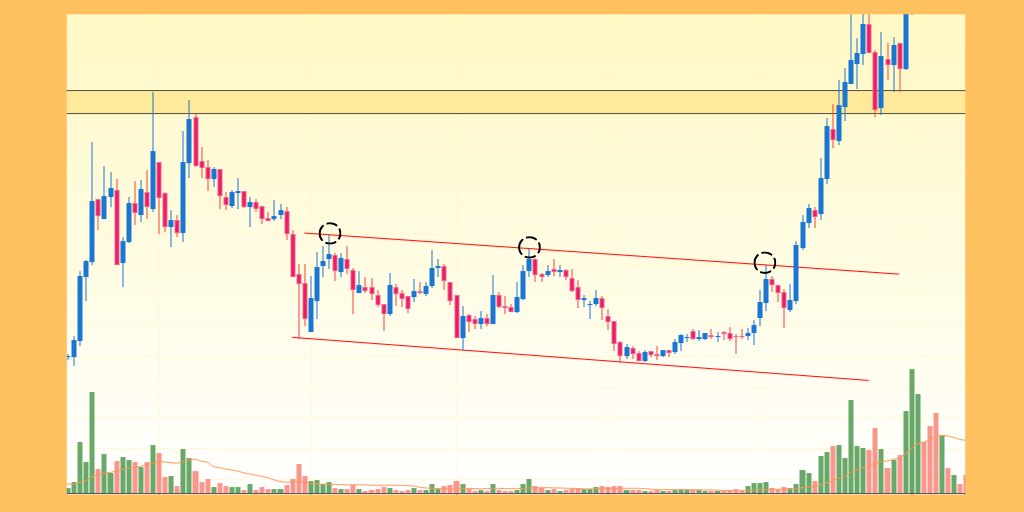
Trend is bullish when price is above the PSAR, it is bearish when price is below PSAR. You can use it as a trend filtration method.
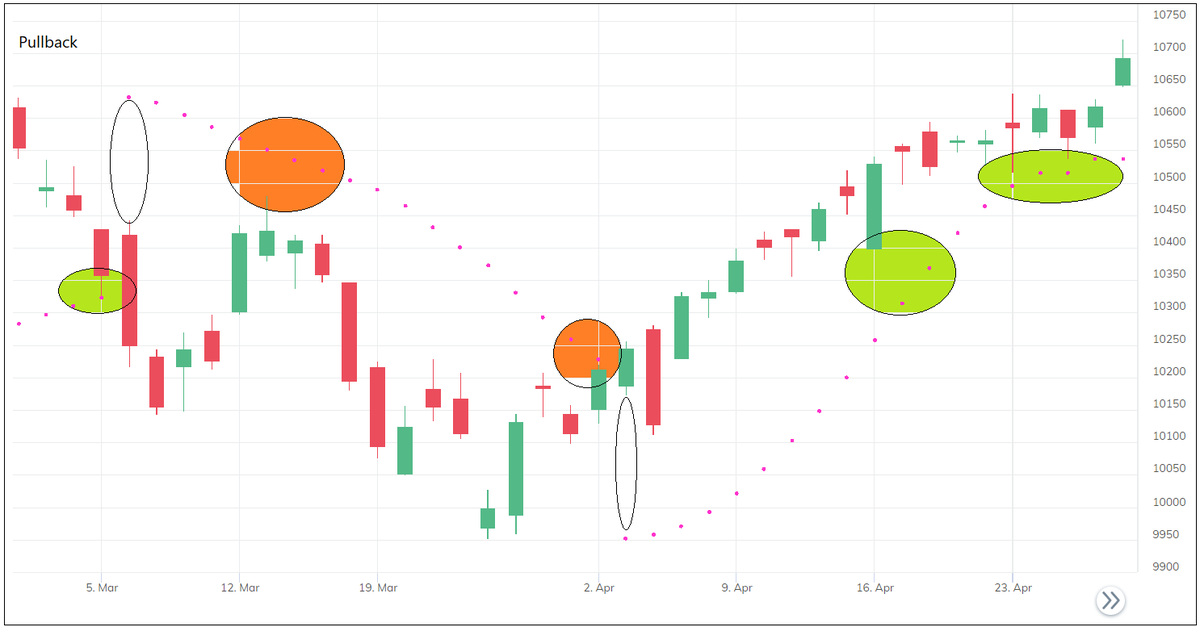
Indicator accelerates during strong trends. Hence, rising PSAR and Falling PSAR are also important.
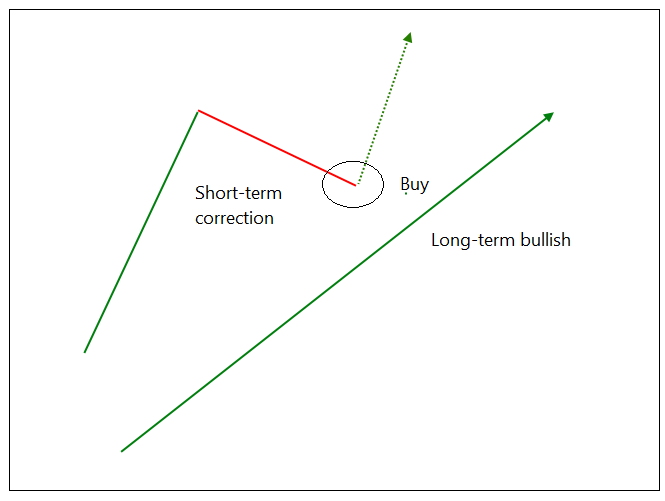
When trend changes, the length of the stop-loss depends on the previous high or low. Avoid the signal if initial stop-loss is not affordable. Wait for the pullback pattern that provides better risk-reward trade
It can be used alone or combined with other studies to design the system.
Below are some Important things about PSAR indictor:
• Unlike many other indicators, you do not have to define the look-back period, define the acceleration factor
• It does not use method of averaging
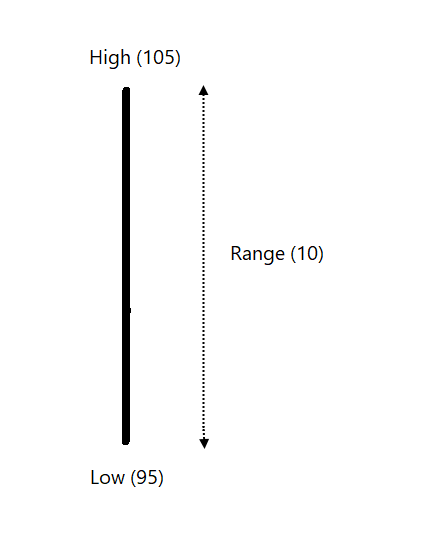
• It uses high, low prices to determine the trend and stop-loss level
• Indicator accelerates if trend is strong
More from Prashant Shah


More from Trading


You May Also Like


I just finished Eric Adler's The Battle of the Classics, and wanted to say something about Joel Christiansen's review linked below. I am not sure what motivates the review (I speculate a bit below), but it gives a very misleading impression of the book. 1/x
The meat of the criticism is that the history Adler gives is insufficiently critical. Adler describes a few figures who had a great influence on how the modern US university was formed. It's certainly critical: it focuses on the social Darwinism of these figures. 2/x
Other insinuations and suggestions in the review seem wildly off the mark, distorted, or inappropriate-- for example, that the book is clickbaity (it is scholarly) or conservative (hardly) or connected to the events at the Capitol (give me a break). 3/x
The core question: in what sense is classics inherently racist? Classics is old. On Adler's account, it begins in ancient Rome and is revived in the Renaissance. Slavery (Christiansen's primary concern) is also very old. Let's say classics is an education for slaveowners. 4/x
It's worth remembering that literacy itself is elite throughout most of this history. Literacy is, then, also the education of slaveowners. We can honor oral and musical traditions without denying that literacy is, generally, good. 5/x
As someone\u2019s who\u2019s read the book, this review strikes me as tremendously unfair. It mostly faults Adler for not writing the book the reviewer wishes he had! https://t.co/pqpt5Ziivj
— Teresa M. Bejan (@tmbejan) January 12, 2021
The meat of the criticism is that the history Adler gives is insufficiently critical. Adler describes a few figures who had a great influence on how the modern US university was formed. It's certainly critical: it focuses on the social Darwinism of these figures. 2/x
Other insinuations and suggestions in the review seem wildly off the mark, distorted, or inappropriate-- for example, that the book is clickbaity (it is scholarly) or conservative (hardly) or connected to the events at the Capitol (give me a break). 3/x
The core question: in what sense is classics inherently racist? Classics is old. On Adler's account, it begins in ancient Rome and is revived in the Renaissance. Slavery (Christiansen's primary concern) is also very old. Let's say classics is an education for slaveowners. 4/x
It's worth remembering that literacy itself is elite throughout most of this history. Literacy is, then, also the education of slaveowners. We can honor oral and musical traditions without denying that literacy is, generally, good. 5/x

Tip from the Monkey
Pangolins, September 2019 and PLA are the key to this mystery
Stay Tuned!

1. Yang
2. A jacobin capuchin dangling a flagellin pangolin on a javelin while playing a mandolin and strangling a mannequin on a paladin's palanquin, said Saladin
More to come tomorrow!

3. Yigang Tong
https://t.co/CYtqYorhzH
Archived: https://t.co/ncz5ruwE2W

4. YT Interview
Some bats & pangolins carry viruses related with SARS-CoV-2, found in SE Asia and in Yunnan, & the pangolins carrying SARS-CoV-2 related viruses were smuggled from SE Asia, so there is a possibility that SARS-CoV-2 were coming from
Pangolins, September 2019 and PLA are the key to this mystery
Stay Tuned!
1. Yang
Meet Yang Ruifu, CCP's biological weapons expert https://t.co/JjB9TLEO95 via @Gnews202064
— Billy Bostickson \U0001f3f4\U0001f441&\U0001f441 \U0001f193 (@BillyBostickson) October 11, 2020
Interesting expose of China's top bioweapons expert who oversaw fake pangolin research
Paper 1: https://t.co/TrXESKLYmJ
Paper 2:https://t.co/9LSJTNCn3l
Pangolinhttps://t.co/2FUAzWyOcv pic.twitter.com/I2QMXgnkBJ
2. A jacobin capuchin dangling a flagellin pangolin on a javelin while playing a mandolin and strangling a mannequin on a paladin's palanquin, said Saladin
More to come tomorrow!
3. Yigang Tong
https://t.co/CYtqYorhzH
Archived: https://t.co/ncz5ruwE2W
4. YT Interview
Some bats & pangolins carry viruses related with SARS-CoV-2, found in SE Asia and in Yunnan, & the pangolins carrying SARS-CoV-2 related viruses were smuggled from SE Asia, so there is a possibility that SARS-CoV-2 were coming from