#tatasteel has been 1 of the most bullish steel stocks
RSI & MACD shows strong upwards momentum
Stock undergoing flag pattern consolidation after swift upmove
If the stock is able to sustain above 1480, it may rally towards 1700-1720 region
#Nifty
Not trading call, academic post

More from Techno Prince


More from Tatasteel


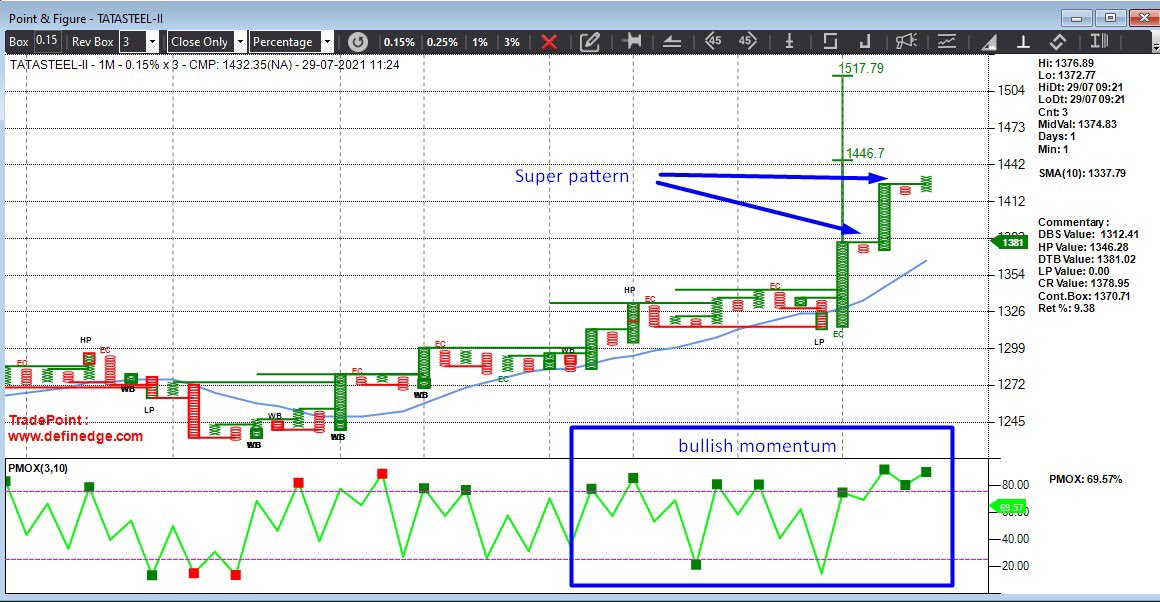

#TataSteel 1st target is done, 1481 is the high posted till now. Marching well towards 1600 now.
#TataSteel #NiftyMetal #StockToWatch
— Team MD&ABN (@team_md_abn) July 7, 2021
CMP - 1224.80
Buy range - 1190-1200
Upside Possible Levels
Conservative - 1395
Aggressive - 1600
The view will be invalid if closes below 1129 pic.twitter.com/e6MabwG9YI