#tatapower
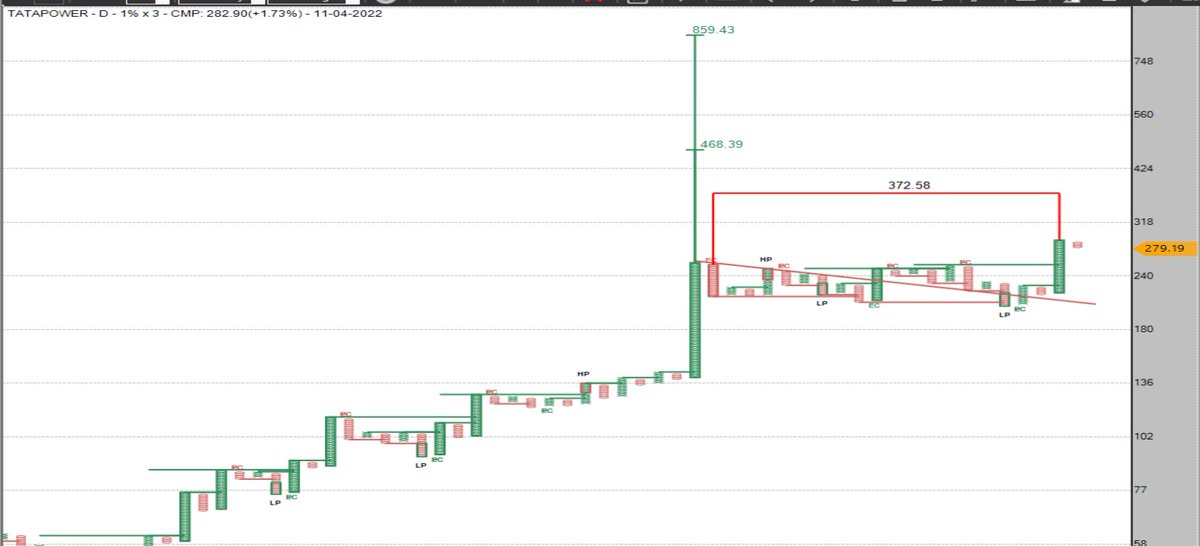
Cmp: 282.90
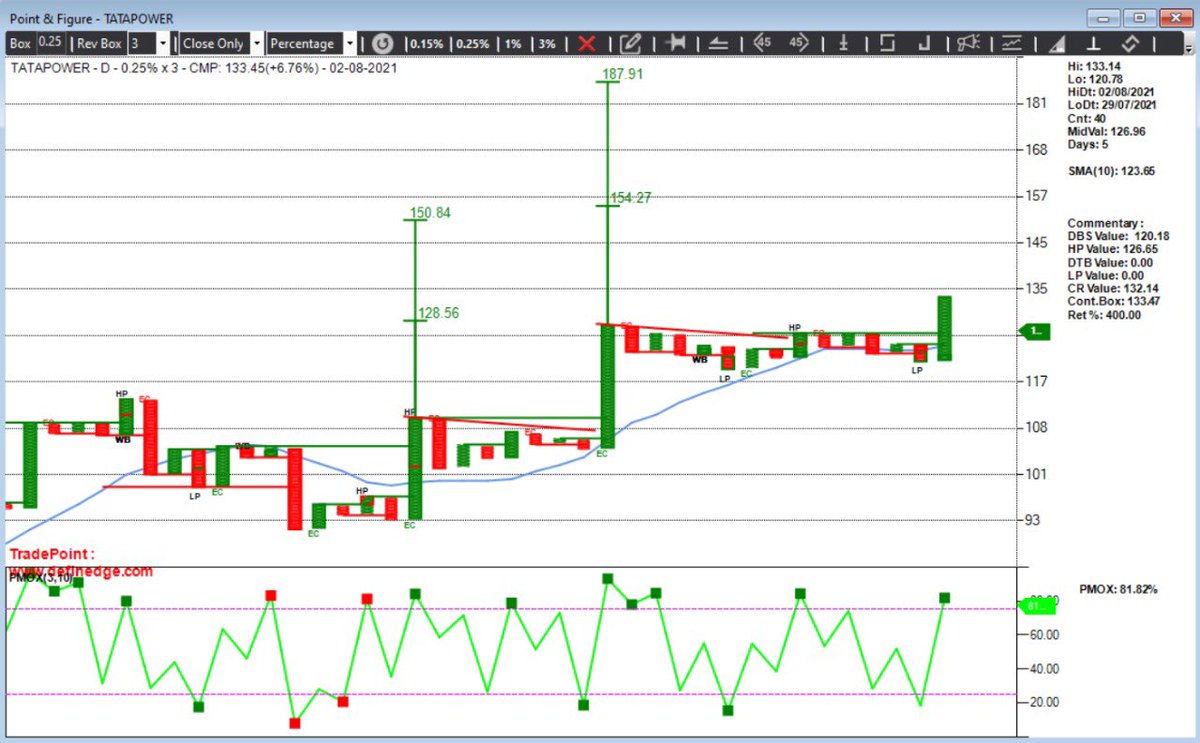
Above 290.6 close will be a Bullish Turtle Follow through.
Nearest Support: 250
If closes above 290.6 then nearest support could move to 276
Open Count: 372/ 468
More from Abhishek
Nifty Futures Positional Trading Using Point & Figure Charts
Following this system on stocks since 2021 and started on Index in 2022
Based on Richard Dennis's Turtle Trading System and the P&F version was created by @Prashantshah267
Details
Chart Settings
Instrument: Nifty Futures ( Current Month)
Chart : Point & Figure
Box Size: 0.10%
Reversal Box: 3
Data Frequency- 1 Min
P&F Charts don't have concept of time but it has a concept Data Frequency, i.e. duration after which to consider plotting X or O on the chart
Since DF is 1 Min here, so we need to wait for 1 Min closing on P&F Charts for Entry, Exit Signals
The chart is an Intraday Chart & requires Intraday data
Which is available on the Real Time Tradepoint Software & on the Web Version of this software
https://t.co/oAshC7rfD1
-
Let's now Discuss Bullish Entry Pattern
The Entry Pattern is called as a Bullish Follow Through Turtle Buy Pattern
This actually comprises of 2 Parts
1. Bullish Turtle Breakout
2. Bullish Turtle Follow Through
For Entry, #1 must happen and there must be a #2 immediately
First Let's Understand the Bullish Turtle Breakout Pattern
This is a 5 X BO Pattern
If current column of X goes above highest ‘X’ in last 5 columns (including current column), then it is a 5-X Turtle breakout.
Following this system on stocks since 2021 and started on Index in 2022
Based on Richard Dennis's Turtle Trading System and the P&F version was created by @Prashantshah267
Details
Chart Settings
Instrument: Nifty Futures ( Current Month)
Chart : Point & Figure
Box Size: 0.10%
Reversal Box: 3
Data Frequency- 1 Min
P&F Charts don't have concept of time but it has a concept Data Frequency, i.e. duration after which to consider plotting X or O on the chart
Since DF is 1 Min here, so we need to wait for 1 Min closing on P&F Charts for Entry, Exit Signals
The chart is an Intraday Chart & requires Intraday data
Which is available on the Real Time Tradepoint Software & on the Web Version of this software
https://t.co/oAshC7rfD1
-
Let's now Discuss Bullish Entry Pattern
The Entry Pattern is called as a Bullish Follow Through Turtle Buy Pattern
This actually comprises of 2 Parts
1. Bullish Turtle Breakout
2. Bullish Turtle Follow Through
For Entry, #1 must happen and there must be a #2 immediately
First Let's Understand the Bullish Turtle Breakout Pattern
This is a 5 X BO Pattern
If current column of X goes above highest ‘X’ in last 5 columns (including current column), then it is a 5-X Turtle breakout.
More from Tatapower
Tata Power
A good portfolio stock for this calender year!!
here is the technical chart with approximate lengths
cheers https://t.co/b5plJ1EqxT
A good portfolio stock for this calender year!!
here is the technical chart with approximate lengths
cheers https://t.co/b5plJ1EqxT
In the power sector - recent entries
— Moneyspinners - Work Hard, Dream Big!! (@Jai0409) April 5, 2022
-Tata Power
-Borosil Renewables
will share EW charts, stay tuned
cheers
Tata Power - no one was reading my tweet back then but I was still sharing my charts after I joined Twitter.
Otw to 235 & 285 https://t.co/JgvNjKT3al
Tata Power - perfect for fresh long. Weak below 70. @nishkumar1977 @suru27 @rohanshah619 @indian_stockss @sanstocktrader @BissaGauravB @RajarshitaS @PAVLeader @Rishikesh_ADX @VijayThk @Investor_Mohit @TrendTrader85 pic.twitter.com/dfrFtr4yi9
— The_Chartist \U0001f4c8 (@nison_steve) December 18, 2020