https://t.co/YXvnzxegSC
A Master thread on @Singh7575 Sir's Long Only Setups with examples on Charts!
This setup is a gift to anyone who trades long ideas and those who want to trade in CASH due to Capital Constraint. Fits best for people who don't do FNO as this picks some amazing scripts.
https://t.co/YXvnzxegSC
This setup best fits in @tradingview /@zerodhaonline or any broker that provides charting. We only need 2 Indicators.
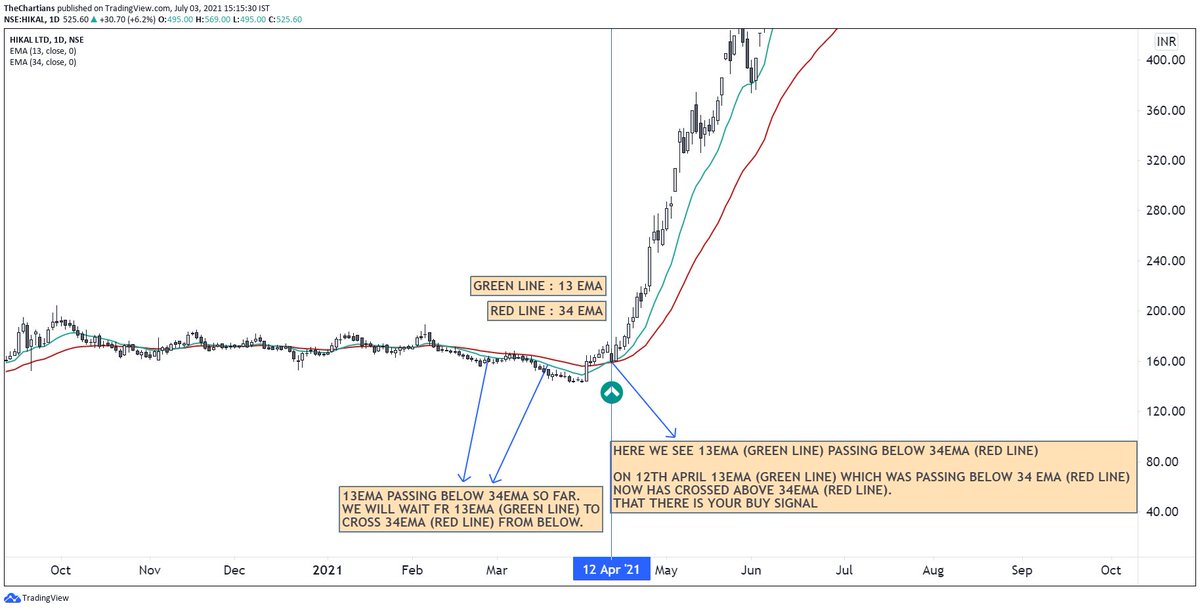
Indicator 1- 13EMA
Indicator 2 - 34EMA
Both indicators are compulsory and should be exponential(EMA) instead of Simple moving average.(SMA)
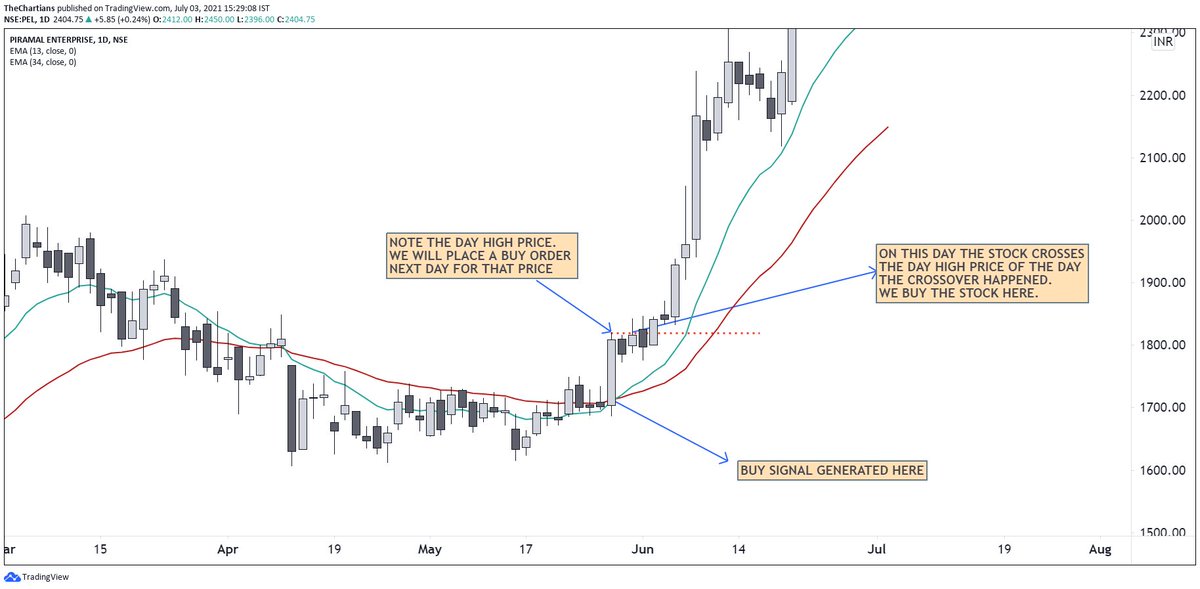
Whenever this Setup meets a condition where 13EMA crosses 34EMA from below as depicted in the chart. Whenever the 13EMA crosses 34EMA from below it is a LONG (BUY) SIGNAL.
❗️Timeframe needs to be Daily Only!

The Condition is to place order above the Day's High when crossover happened. Place buying bid above Previous Day’s high. If on current day the stock
doesn’t cross previous day’s high, place a buying bid the next day above current day’s high. For E.g.

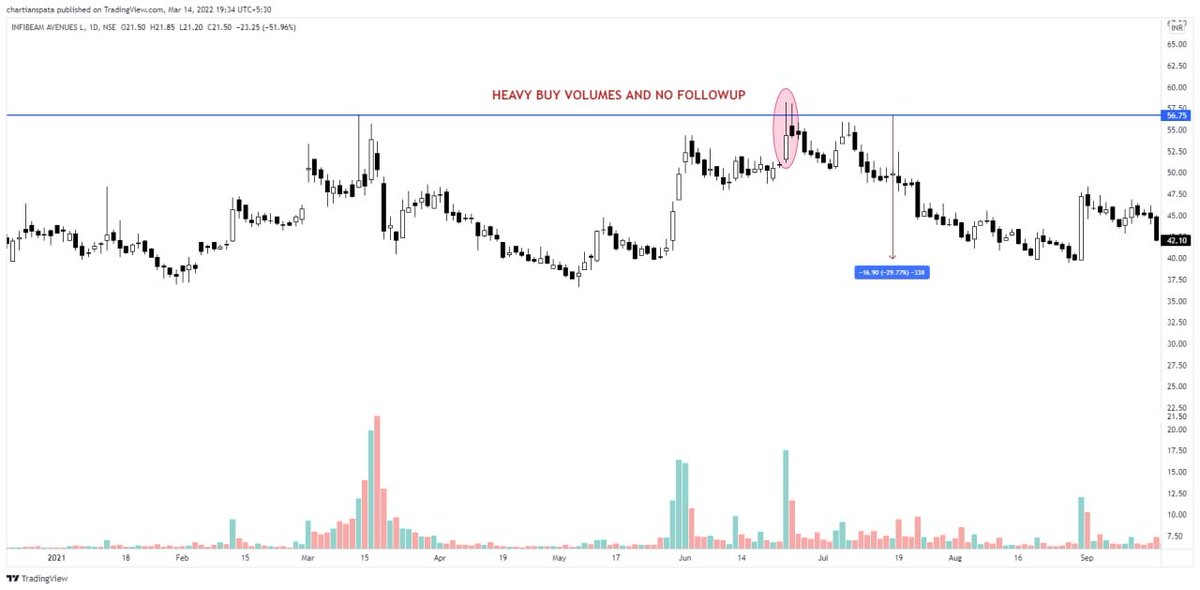
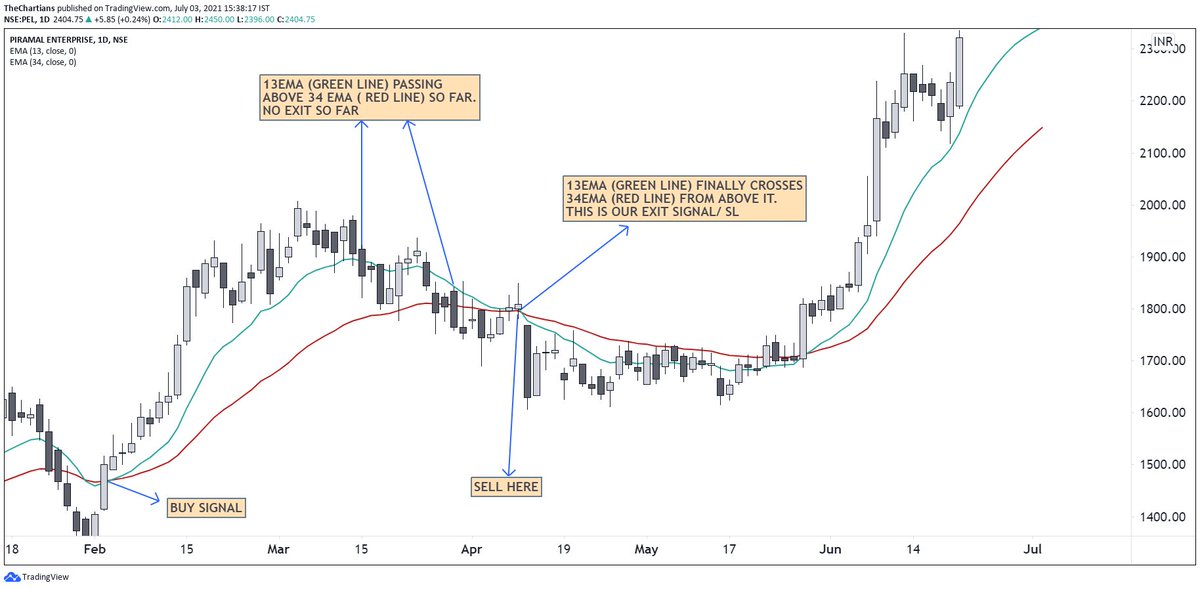
Whenever the 13EMA crosses 34EMA from above it is a signal to EXIT or take your SL. For E.g.

SL is a very subjective but vital part in any trading setup. Some take SL based on certain%, PREVIOUS DAY LOW, WEEK LOW. For our comfort on the system we usually take SL as following.
Entry is near a SWING LOW we take SWING LOW as SL.
Let's see how we did it.
Angad Sir's YouTube Channel.
https://t.co/NyAnucpLjU
More from The Chartians
#chartkyaboltahai
- 730 dop can be bought for tgt of 1000.
- Stock has made first HH-HL.
- Breaking previous swing low.
- Ascending traingle pattern on daily.
@ydstartupreneur
@caniravkaria bhaiji looks good on charts https://t.co/iwy4wXUiJf

#chart kya bolta hai?#kiska weekly chart hai?
— Yash Dugar (@ydstartupreneur) July 10, 2021
It is said that when weekly trend reversals are with huge volumes & strong RSI the stock becomes a good positional trade/investment.
Those who will answer it fully correctly will get access to our full report on it by @FinterestC pic.twitter.com/I4DX29TpRg
Dip*
Data says 81% of people trade these patterns incorrectly, and you might be one of them.
Read now or regret later:: A complete guide on Top 5 chart patterns in this thread 🧵:
1/ Rounding Bottom:
Rounding Bottom or U Pattern or Saucer all are one and the same with different names and it is a bullish
Trading on chart patterns is difficult, Until you see this:
— The Chartians (@chartians) August 6, 2022
Free Technical Analysis course (1/10) \U0001f9f5
2/ Cup and Handle:
A bullish technical pattern that is very popular in Technical
Trading on chart patterns is difficult, Until you read this ! \u26a1\ufe0f
— The Chartians (@chartians) August 21, 2022
Everything about Cup and Handle Pattern
Free Technical Analysis course (2/10) \U0001f9f5
3/ Ascending Triangle:
Ascending triangle is created by price moves that allow for a horizontal line to be drawn along the swing highs and a rising trendline to be drawn along the swing
Trading on chart patterns is difficult until you read this !\u26a1\ufe0f
— The Chartians (@chartians) August 28, 2022
Everything about Ascending Triangle Pattern
Free Technical Analysis course (3/10) \U0001f9f5
4/ Head and Shoulder Pattern:
It is one of several top patterns that signal an upward trend is nearing its
Trading on chart patterns is difficult, Until you read this ! \u26a1\ufe0f
— The Chartians (@chartians) October 9, 2022
Everything about Head and Shoulder Pattern
Free Technical Analysis course (4/10) \U0001f9f5