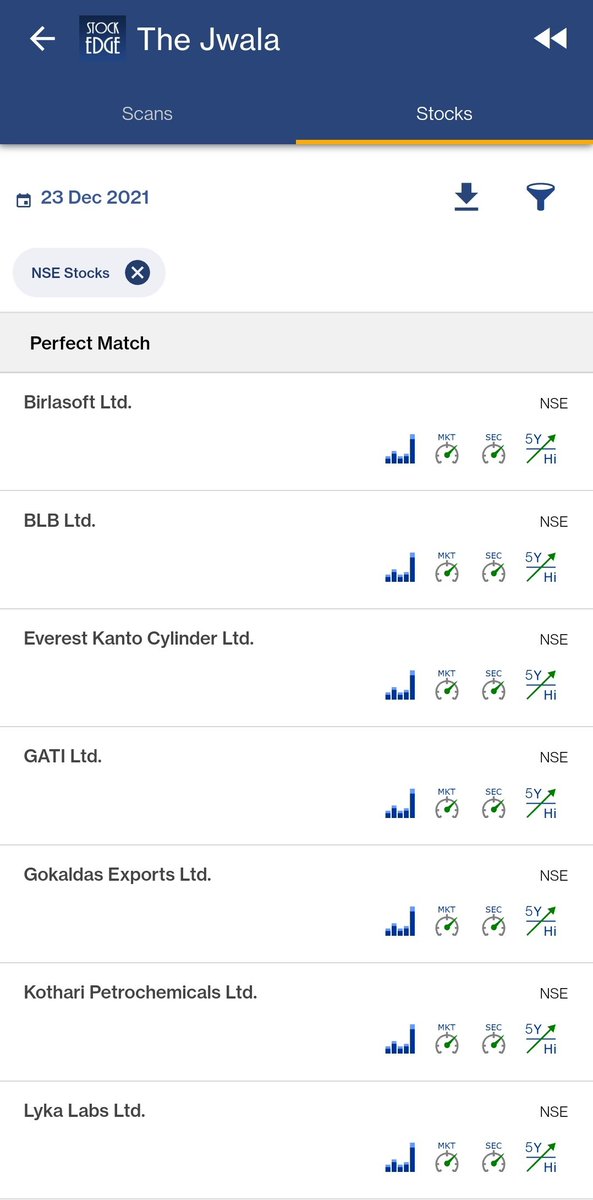
#StockEdge Presents: The Jwala : A Special Combination Scan!
🧵...
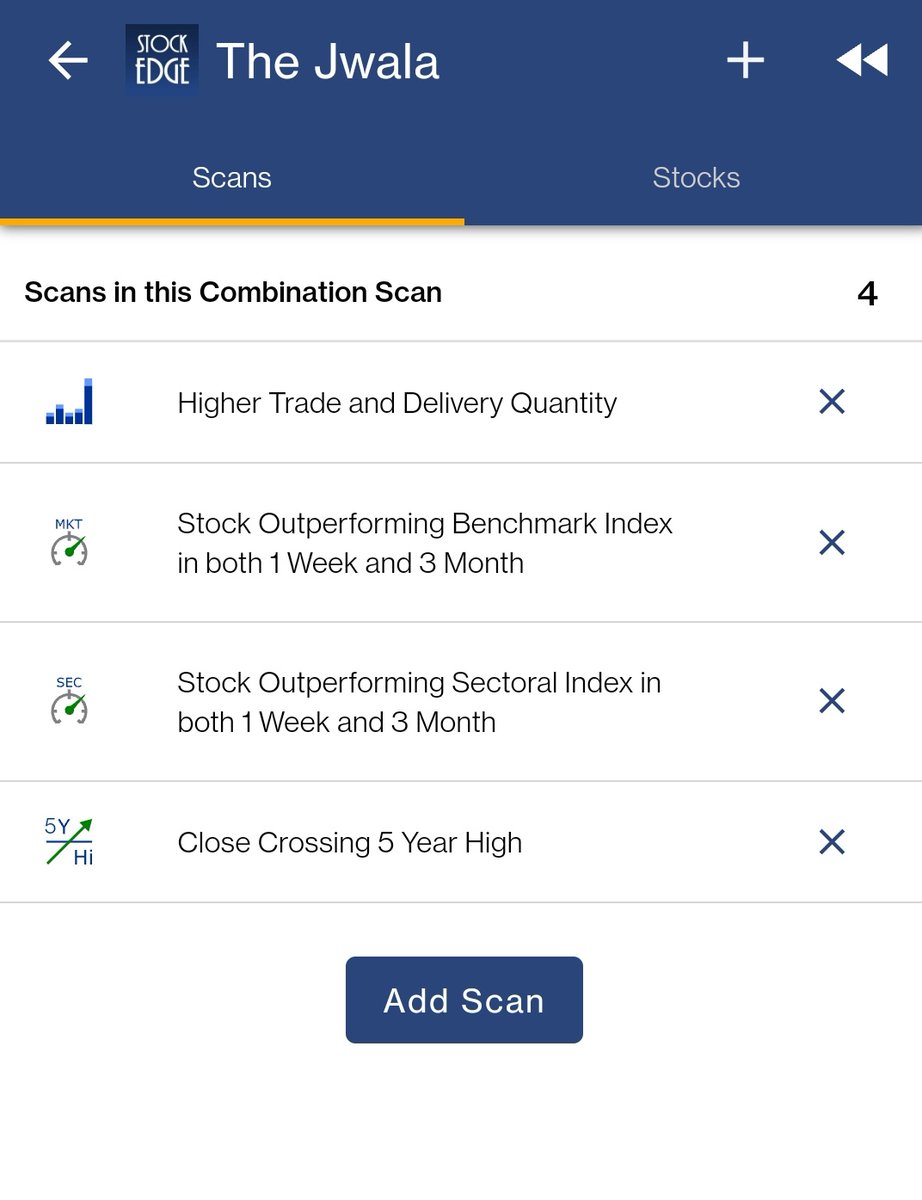
Higher Trade and Delivery Quantity: https://t.co/EL5Qei0mnp
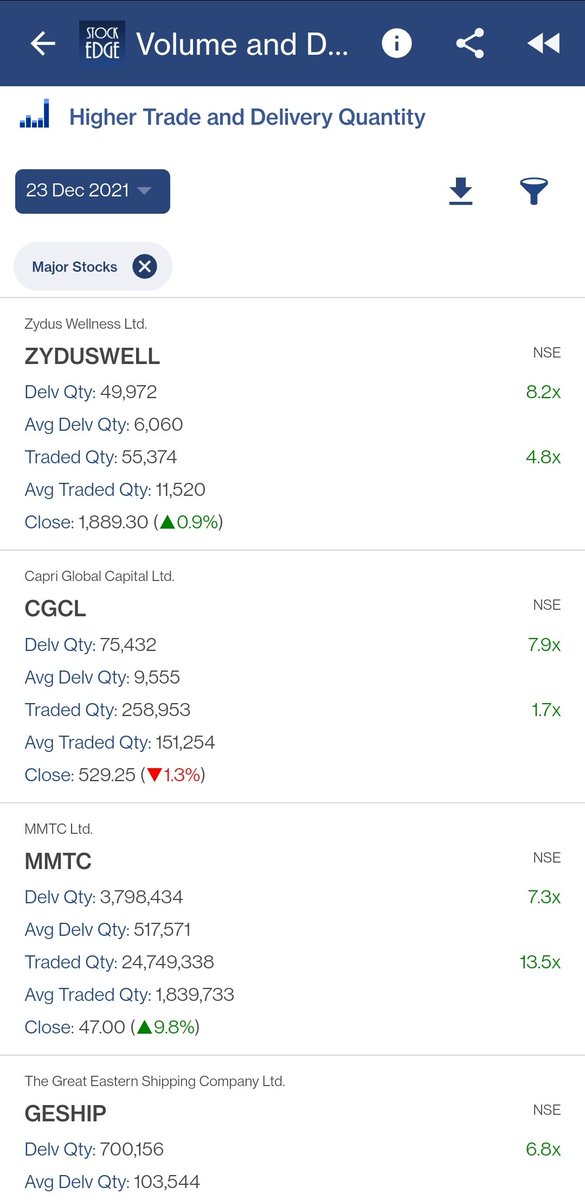
Stock Outperforming Benchmark Index In Both 1 Week And 3 Month: https://t.co/pcMzVXMbdO
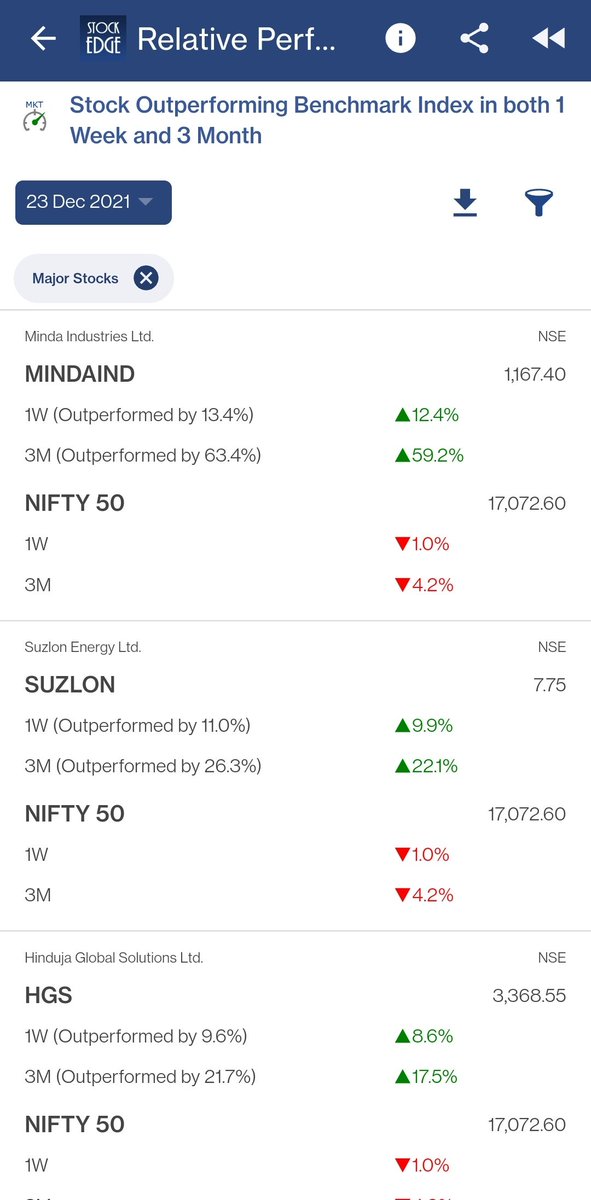
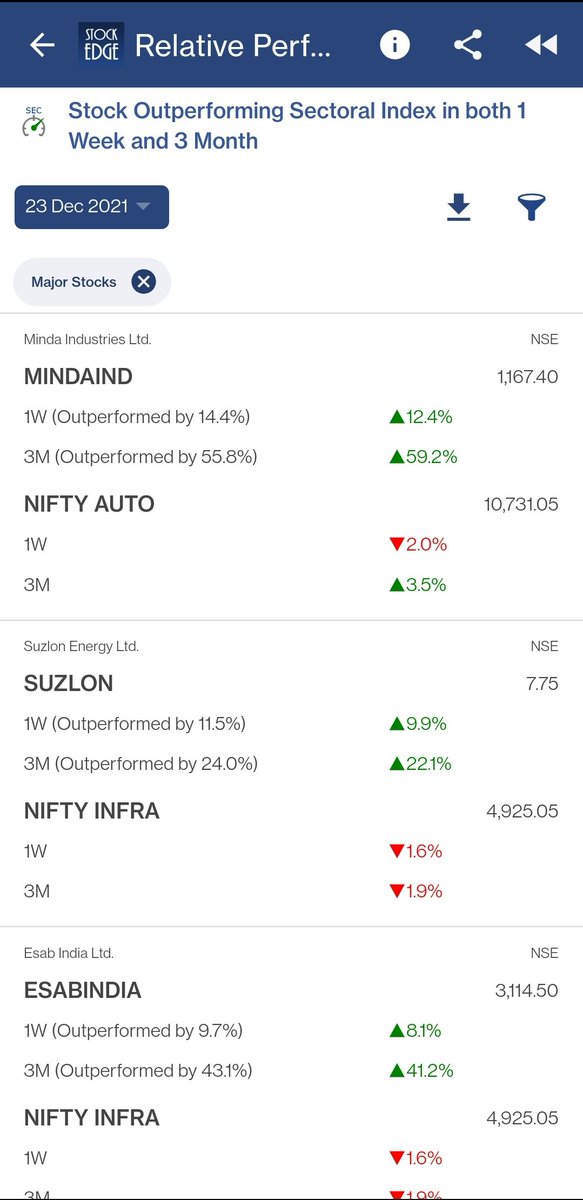
Stock Outperforming Sectoral Index In Both 1 Week And 3 Month: https://t.co/ajJ8jIatdo

What's your favourite combo scan? Share with us!
Use Coupon Code JINGLE36 For 36% Off!

More from StockEdge
StockEdge Presents: Strong RS Stocks With Squeeze Eruption: A Special Combination Scan!
🧵...
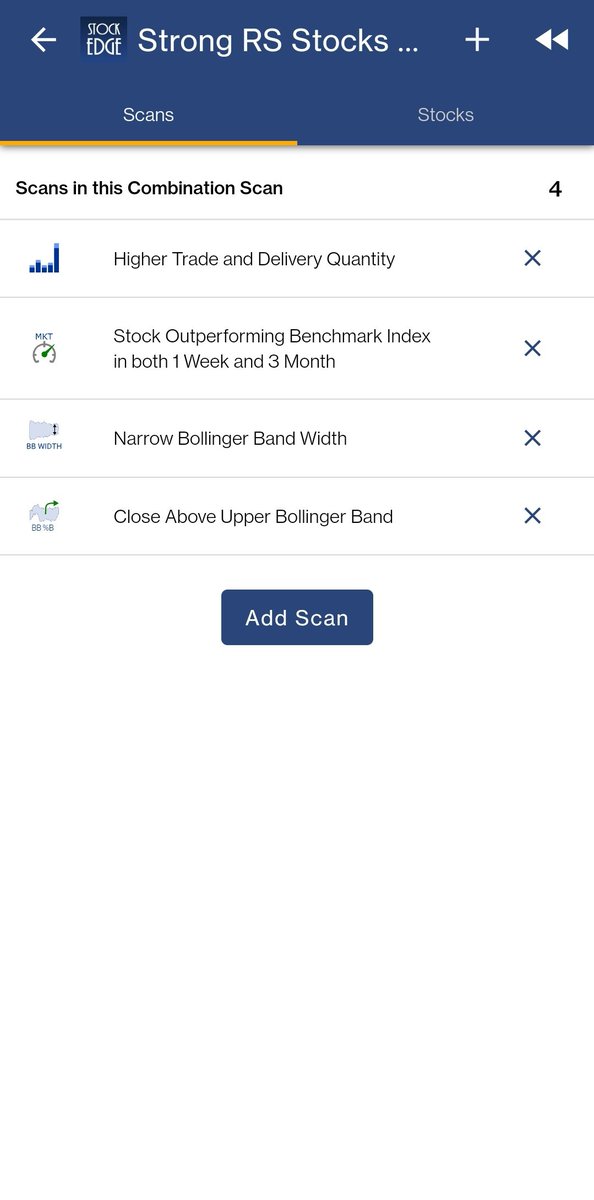
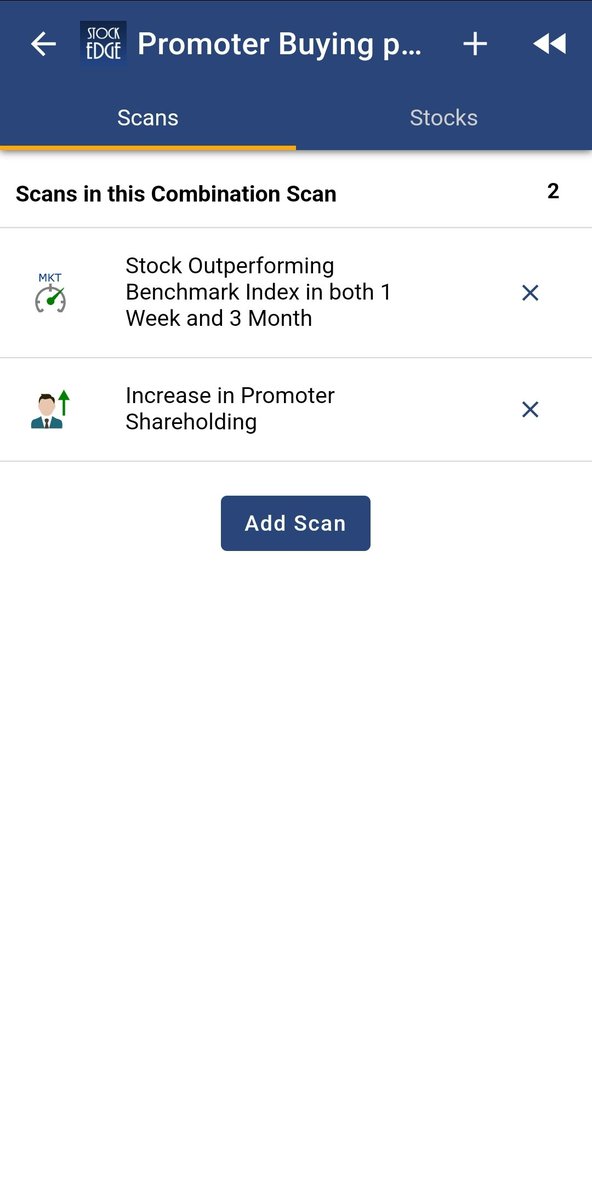
This combination scan identifies stocks that are outperforming Benchmark Indices in 1 week as well as 3 months time frame.
It also identities stocks that have consolidated in a narrow range for some time and breaks the zone with a higher trade & delivery quantity.
Some of the scans used in the combination include
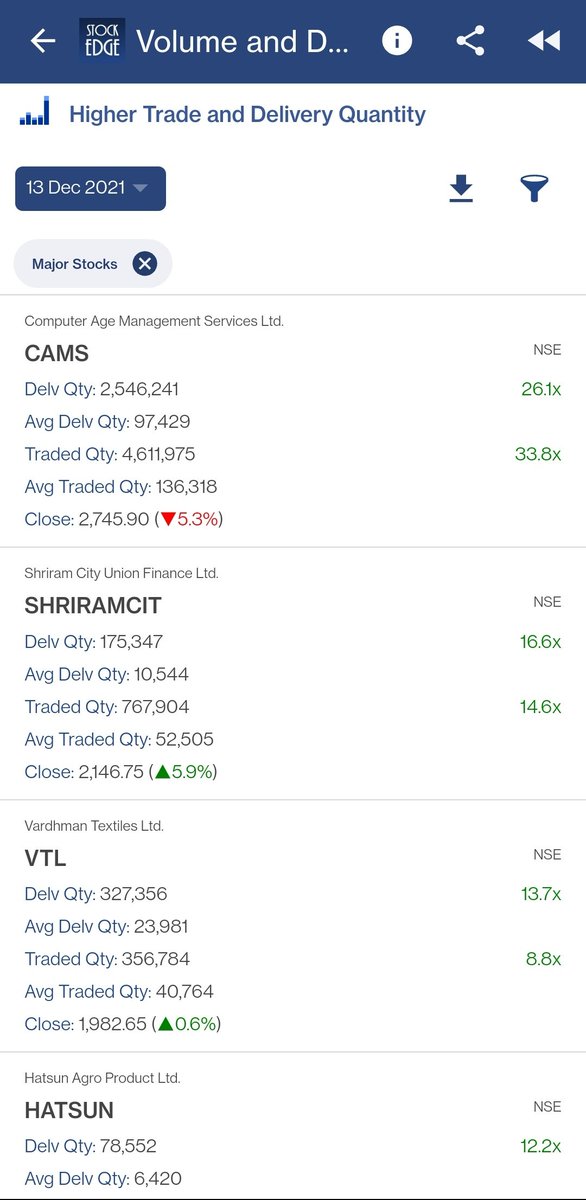
-Higher Trade and Delivery Quantity https://t.co/9CiSwEADrF
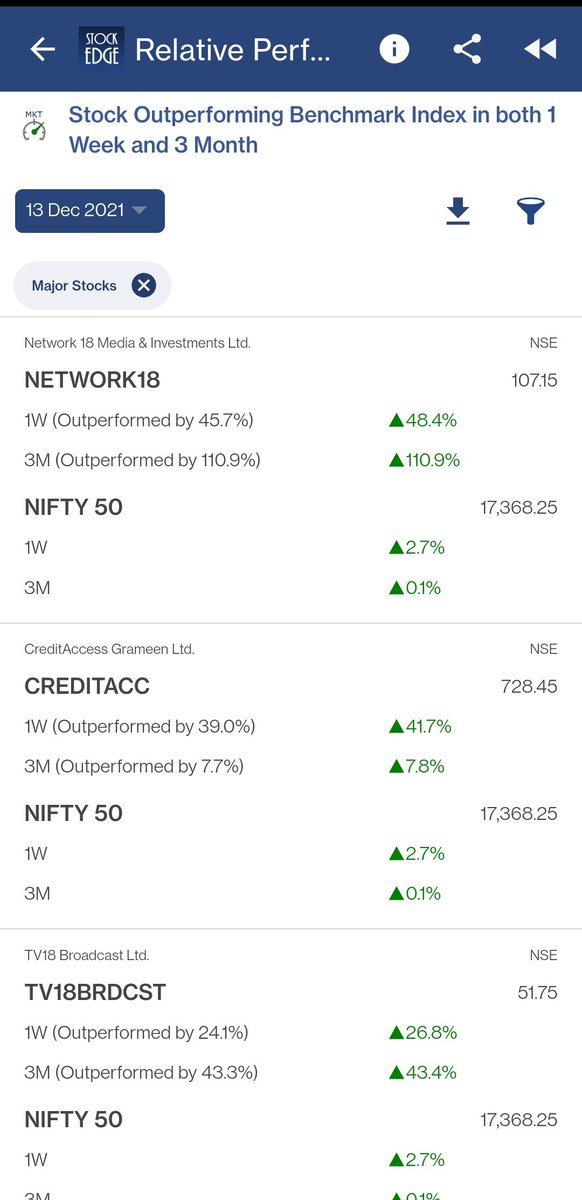
The second scan used here is Stocks Outperforming Benchmark Index in both 1 week and 3 month: https://t.co/dv9e3KK810
🧵...
This combination scan identifies stocks that are outperforming Benchmark Indices in 1 week as well as 3 months time frame.
It also identities stocks that have consolidated in a narrow range for some time and breaks the zone with a higher trade & delivery quantity.
Some of the scans used in the combination include
-Higher Trade and Delivery Quantity https://t.co/9CiSwEADrF
The second scan used here is Stocks Outperforming Benchmark Index in both 1 week and 3 month: https://t.co/dv9e3KK810
One of our users submitted a special Scan:
A THREAD(🧵)....(1/7)
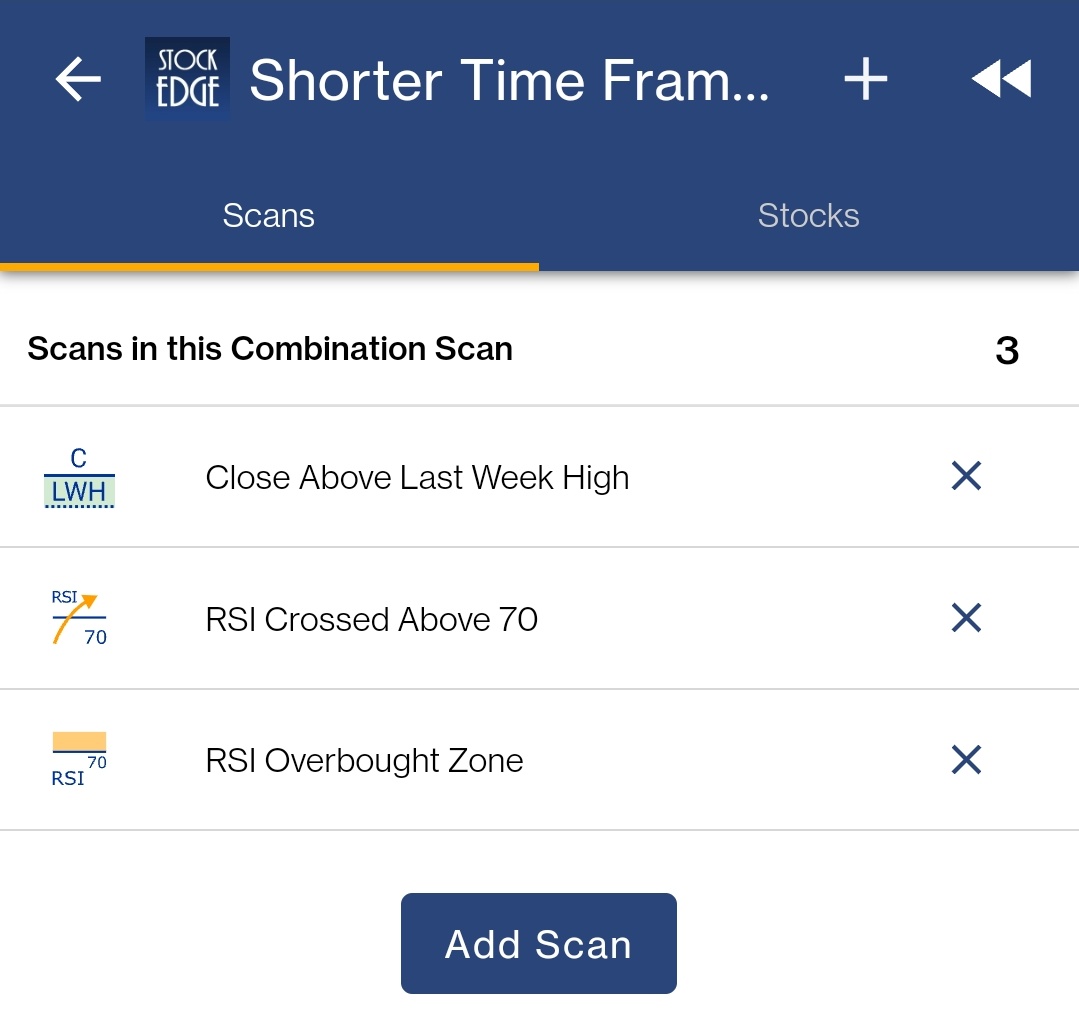
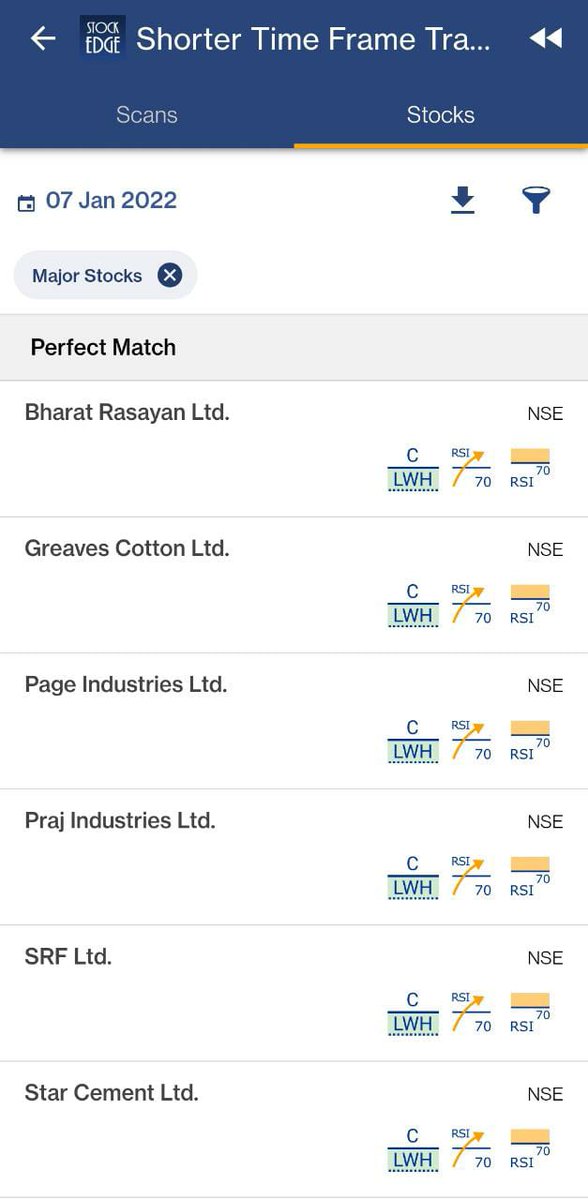
This Combo scan tries to filter stocks based on strong momentum for short term trades
(2/7)
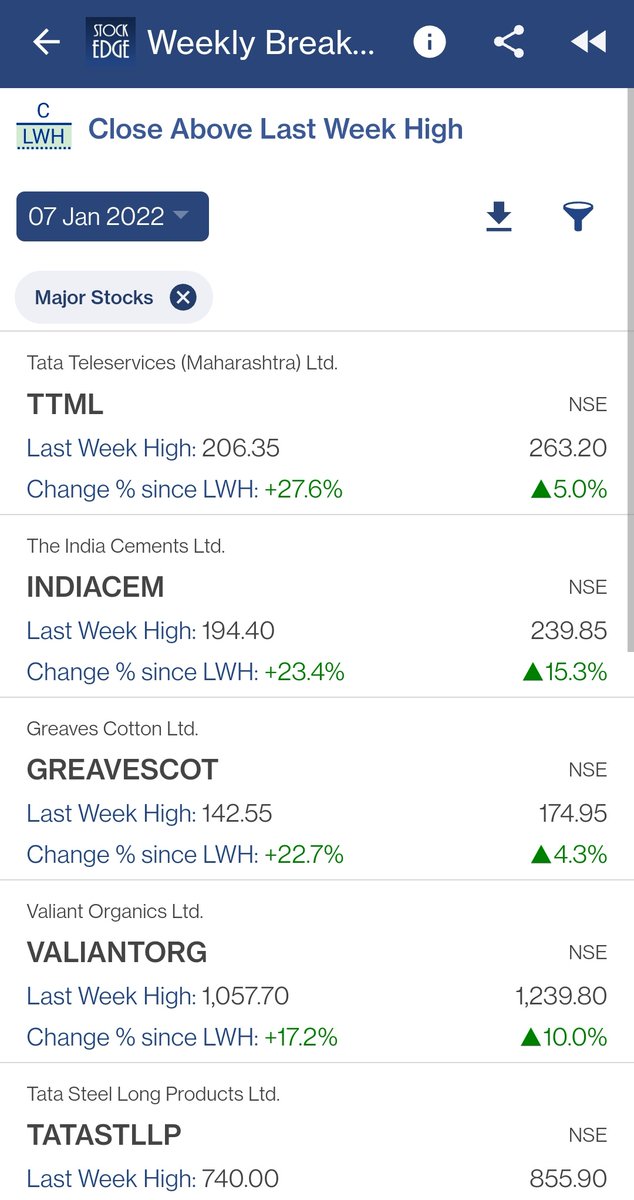
The first scan used here is Close Above Last Week High
https://t.co/ehv5ke8sxc
(3/7)
The Second Scan in the combo is RSI Crossed above 70 https://t.co/q4NpyFYuBD
(4/7)
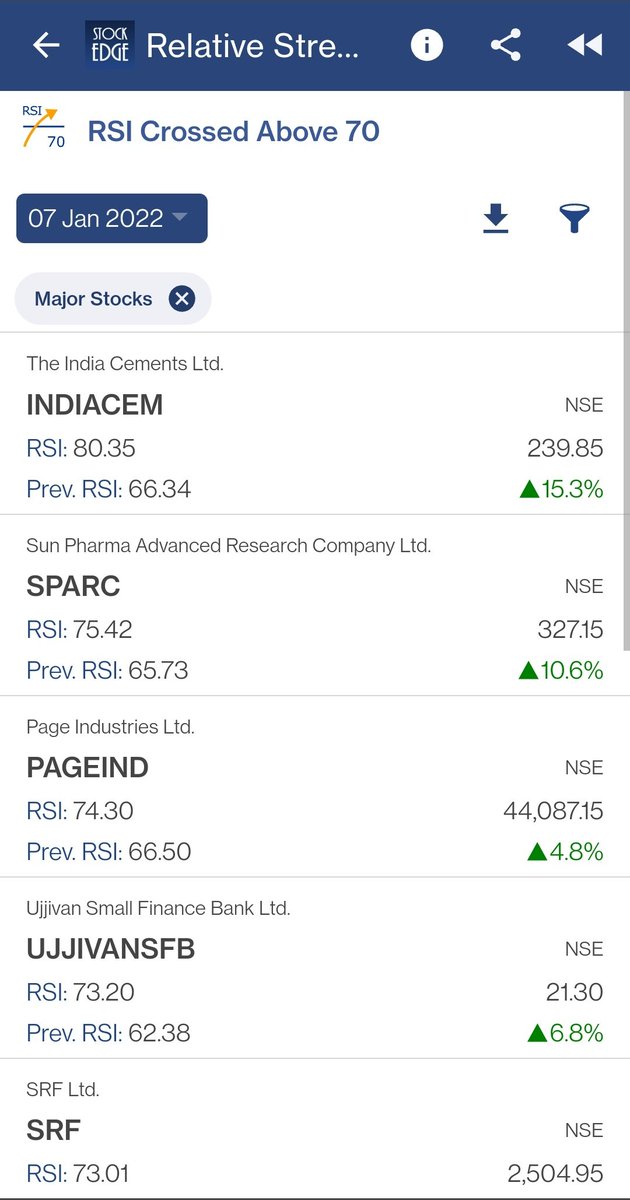
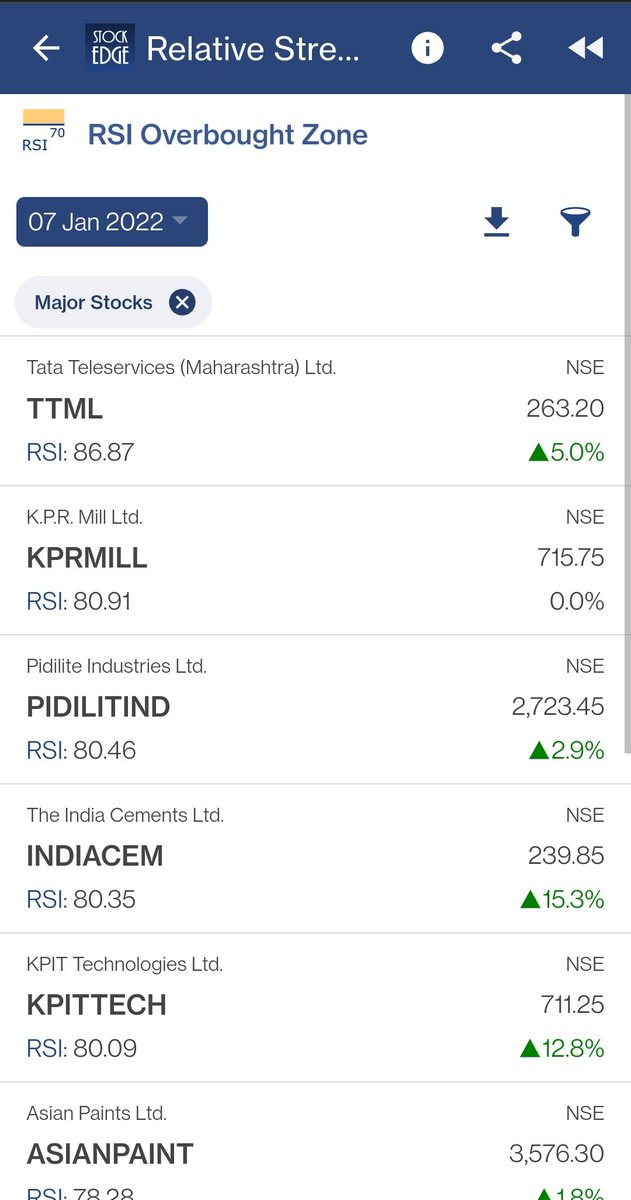
The Third Scan used here is RSI Overbought Zone https://t.co/5uZxwnLAUD
(5/7)
A THREAD(🧵)....(1/7)
This Combo scan tries to filter stocks based on strong momentum for short term trades
(2/7)
The first scan used here is Close Above Last Week High
https://t.co/ehv5ke8sxc
(3/7)
The Second Scan in the combo is RSI Crossed above 70 https://t.co/q4NpyFYuBD
(4/7)
The Third Scan used here is RSI Overbought Zone https://t.co/5uZxwnLAUD
(5/7)

More from Stockedge




StockEdge Presents: Strong RS Stocks With Squeeze Eruption: A Special Combination Scan!
🧵...
This combination scan identifies stocks that are outperforming Benchmark Indices in 1 week as well as 3 months time frame.
It also identities stocks that have consolidated in a narrow range for some time and breaks the zone with a higher trade & delivery quantity.
Some of the scans used in the combination include
-Higher Trade and Delivery Quantity https://t.co/9CiSwEADrF
The second scan used here is Stocks Outperforming Benchmark Index in both 1 week and 3 month: https://t.co/dv9e3KK810
🧵...
This combination scan identifies stocks that are outperforming Benchmark Indices in 1 week as well as 3 months time frame.
It also identities stocks that have consolidated in a narrow range for some time and breaks the zone with a higher trade & delivery quantity.
Some of the scans used in the combination include
-Higher Trade and Delivery Quantity https://t.co/9CiSwEADrF
The second scan used here is Stocks Outperforming Benchmark Index in both 1 week and 3 month: https://t.co/dv9e3KK810
One of our users submitted a special Scan:
A THREAD(🧵)....(1/7)
This Combo scan tries to filter stocks based on strong momentum for short term trades
(2/7)
The first scan used here is Close Above Last Week High
https://t.co/ehv5ke8sxc
(3/7)
The Second Scan in the combo is RSI Crossed above 70 https://t.co/q4NpyFYuBD
(4/7)
The Third Scan used here is RSI Overbought Zone https://t.co/5uZxwnLAUD
(5/7)
A THREAD(🧵)....(1/7)
This Combo scan tries to filter stocks based on strong momentum for short term trades
(2/7)
The first scan used here is Close Above Last Week High
https://t.co/ehv5ke8sxc
(3/7)
The Second Scan in the combo is RSI Crossed above 70 https://t.co/q4NpyFYuBD
(4/7)
The Third Scan used here is RSI Overbought Zone https://t.co/5uZxwnLAUD
(5/7)