
So here's something interesting about our latest 'surge'. If one goes to https://t.co/unPSmmc8Mg you can toggle between 'confirmed' cases, 'probable' cases and both of them together.
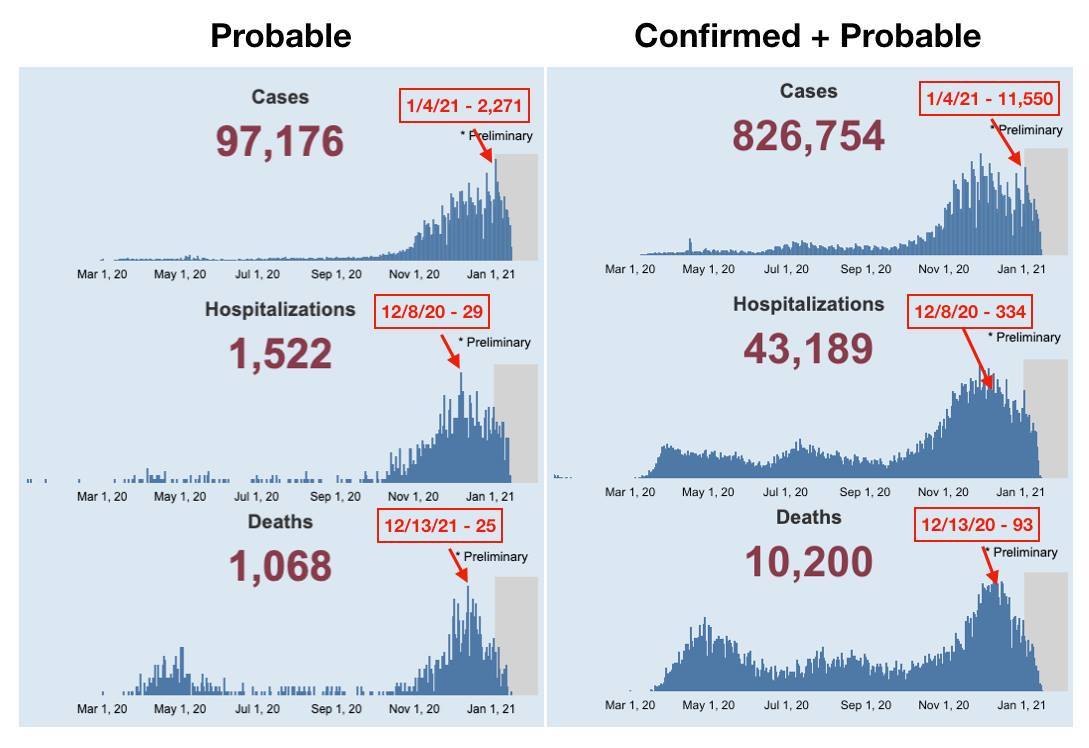
19.7% of January 4th's 'cases' were probable.
8.7% of December 8th's hospitalizations were probable.
26.9% of December 13th's deaths were probable.
Nearly 10% of ALL deaths are considered 'probable' - meaning there was no laboratory confirmation that the deceased even had the virus when they died or during their life at any point.
More from Society

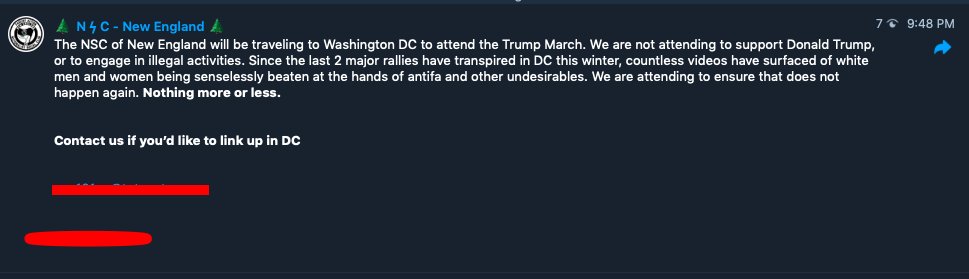
Tomorrow, January 6th, MAGA chuds, Proud Boys, and white supremacists are planned to descend on Washington D.C. to contest the election. Among them will be NSC-131, a New England based neo-Nazi organization. Let's welcome them by saying hi to one of their members, Eddie Stuart!
Edward Stuart, from Chester, New Hampshire, has been a member of Nationalist Social Club (NSC) since the very beginning and is a staple participant in their actions. He is known in NSC chats as "Carl Jung" and is well connected in the New England Nazi scene.
2/

NSC-131 is a neo-Nazi group that was started in Massachusetts in early 2020 by Chris Hood. You can learn more about NSC and it's members in these threads:
Eddie describes his ideology as "Esoteric Hitlerism" which is an occult form of Nazism that literally worships Adolf Hitler as a god, or, specifically, as an incarnation of the Hindu God Vishnu. Here is Ed holding the RigVeda with some of his occult Nazi pals. Interesting Ed!
4/
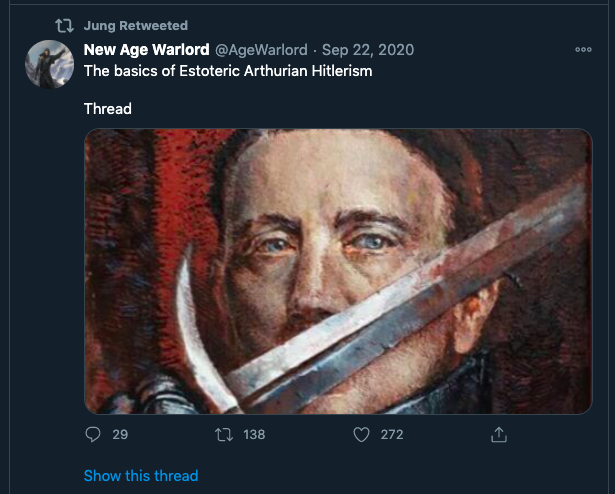
Much of this ideological insight was gained from Eddie's Twitter, where he originally used his "Carl Jung" persona and reposts explicit neo-fascist content and racist memes. In one edited picture, Eddie can be seen at an NSC event in late June 2020 holding a Nazi Sonnenrad flag
5
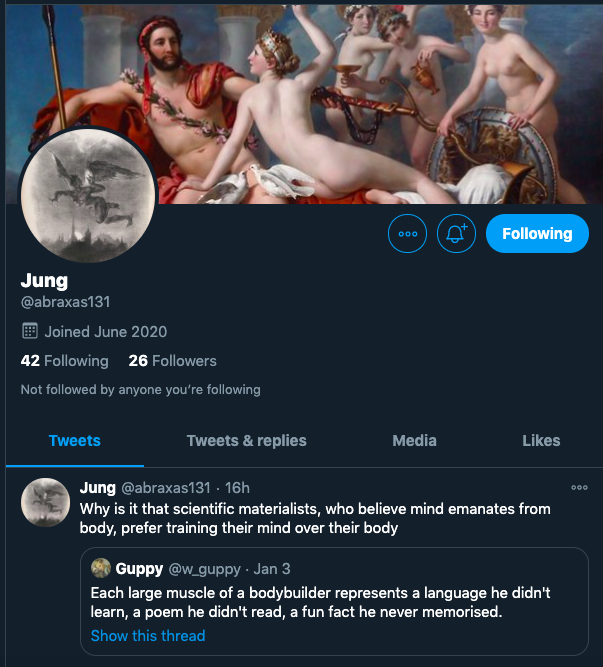
Edward Stuart, from Chester, New Hampshire, has been a member of Nationalist Social Club (NSC) since the very beginning and is a staple participant in their actions. He is known in NSC chats as "Carl Jung" and is well connected in the New England Nazi scene.
2/
NSC-131 is a neo-Nazi group that was started in Massachusetts in early 2020 by Chris Hood. You can learn more about NSC and it's members in these threads:
1/ Let\u2019s talk about a III%er turned Proud Boy turned Resist Marxism turned Patriot Front turned The Base affiliate.
— AntiFash Gordon (@AntiFashGordon) April 10, 2020
He now runs a new crew, the National Socialist Club, based on football hooliganism.\u2070\u2070
Some of you already know him.\u2070\u2070
His name is Chris Hood, of Boston, MA. pic.twitter.com/nXAxWugHcu
Eddie describes his ideology as "Esoteric Hitlerism" which is an occult form of Nazism that literally worships Adolf Hitler as a god, or, specifically, as an incarnation of the Hindu God Vishnu. Here is Ed holding the RigVeda with some of his occult Nazi pals. Interesting Ed!
4/
Much of this ideological insight was gained from Eddie's Twitter, where he originally used his "Carl Jung" persona and reposts explicit neo-fascist content and racist memes. In one edited picture, Eddie can be seen at an NSC event in late June 2020 holding a Nazi Sonnenrad flag
5


You May Also Like


1/x Fort Detrick History
Mr. Patrick, one of the chief scientists at the Army Biological Warfare Laboratories at Fort Detrick in Frederick, Md., held five classified US patents for the process of weaponizing anthrax.
2/x
Under Mr. Patrick’s direction, scientists at Fort Detrick developed a tularemia agent that, if disseminated by airplane, could cause casualties & sickness over 1000s mi². In a 10,000 mi² range, it had 90% casualty rate & 50% fatality rate
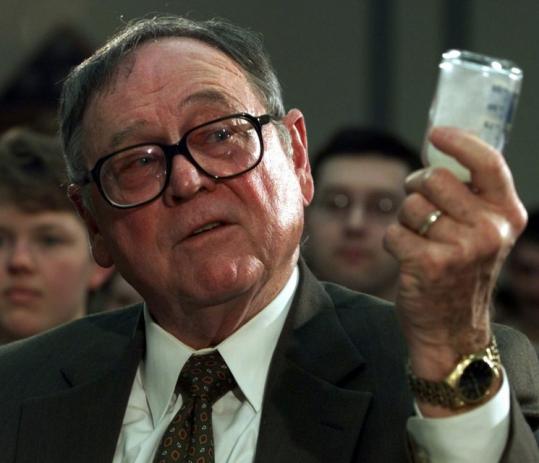
3/x His team explored Q fever, plague, & Venezuelan equine encephalitis, testing more than 20 anthrax strains to discern most lethal variety. Fort Detrick scientists used aerosol spray systems inside fountain pens, walking sticks, light bulbs, & even in 1953 Mercury exhaust pipes

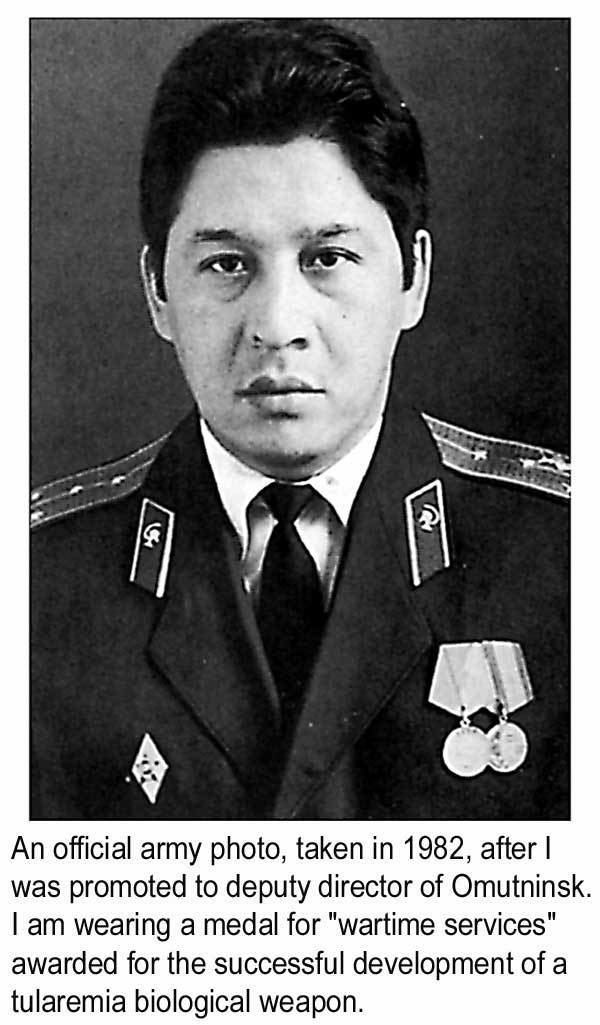
4/x After retiring in 1986, Mr. Patrick remained one of the world’s foremost specialists on biological warfare & was a consultant to the CIA, FBI, & US military. He debriefed Soviet defector Ken Alibek, the deputy chief of the Soviet biowarfare program
https://t.co/sHqSaTSqtB
5/x Back in Time
In 1949 the Army created a small team of chemists at "Camp Detrick" called Special Operations Division. Its assignment was to find military uses for toxic bacteria. The coercive use of toxins was a new field, which fascinated Allen Dulles, later head of the CIA
Mr. Patrick, one of the chief scientists at the Army Biological Warfare Laboratories at Fort Detrick in Frederick, Md., held five classified US patents for the process of weaponizing anthrax.
2/x
Under Mr. Patrick’s direction, scientists at Fort Detrick developed a tularemia agent that, if disseminated by airplane, could cause casualties & sickness over 1000s mi². In a 10,000 mi² range, it had 90% casualty rate & 50% fatality rate
3/x His team explored Q fever, plague, & Venezuelan equine encephalitis, testing more than 20 anthrax strains to discern most lethal variety. Fort Detrick scientists used aerosol spray systems inside fountain pens, walking sticks, light bulbs, & even in 1953 Mercury exhaust pipes
4/x After retiring in 1986, Mr. Patrick remained one of the world’s foremost specialists on biological warfare & was a consultant to the CIA, FBI, & US military. He debriefed Soviet defector Ken Alibek, the deputy chief of the Soviet biowarfare program
https://t.co/sHqSaTSqtB
5/x Back in Time
In 1949 the Army created a small team of chemists at "Camp Detrick" called Special Operations Division. Its assignment was to find military uses for toxic bacteria. The coercive use of toxins was a new field, which fascinated Allen Dulles, later head of the CIA

