Categories Screeners
7 days
30 days
All time
Recent
Popular

Conditions
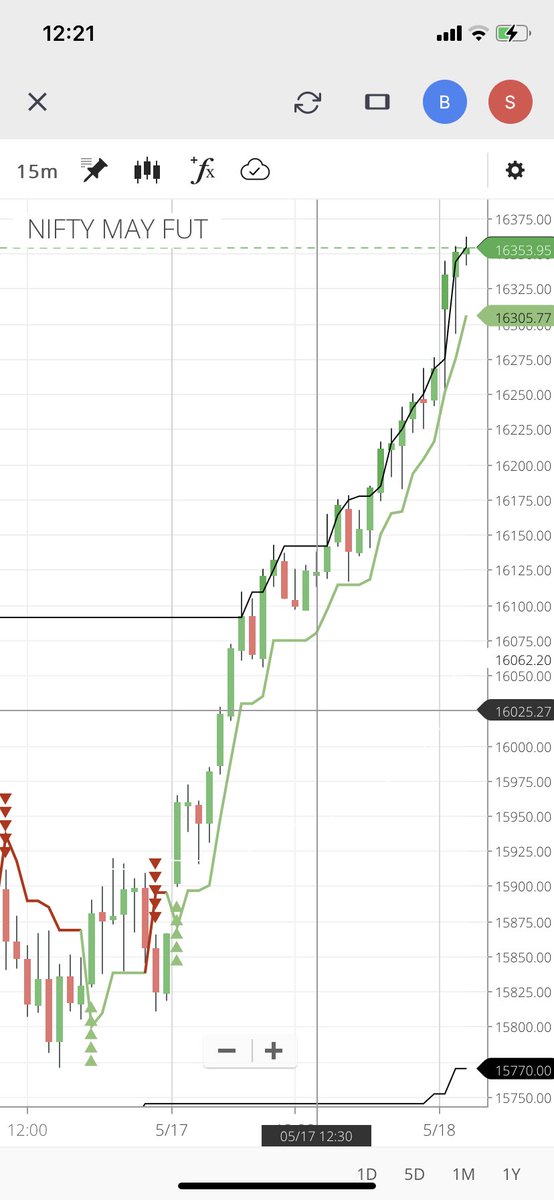
rsi >50
RSI avove ma60
Price above ema 60
It is for indicators lovers.. i see rarely but as per my experience enough setup if one is follow with descipline
rsi >50
RSI avove ma60
Price above ema 60
ITC
— Pramod Sharma\U0001f549\ufe0f\U0001f1ee\U0001f1f3 (@itspramods) March 29, 2022
Try this combo RSI 60 period on 60 min chart
Backtest and tell me result.
Rsi/ma crossover abovev50 level pic.twitter.com/In3xrgWQz0
It is for indicators lovers.. i see rarely but as per my experience enough setup if one is follow with descipline


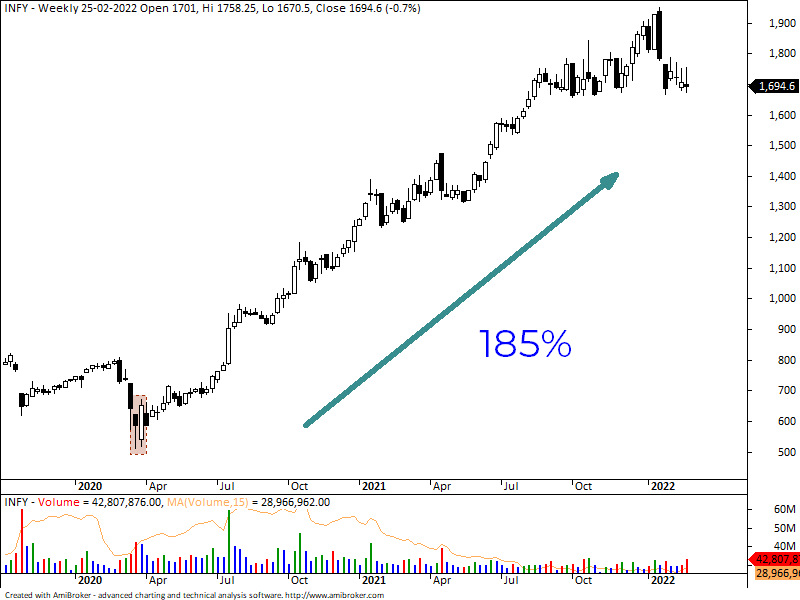


Jab tak ki meri book nahi aati, ye kar lo:
1. Go through Zerodha Varsity chapters on Technical Analysis at least 2 times.
2. Then read 'Technical Analysis Explained' by Martin Pring
3. Finally read 'Price Action bar by bar' by Al Books (Not for casual reader).
1. Go through Zerodha Varsity chapters on Technical Analysis at least 2 times.
2. Then read 'Technical Analysis Explained' by Martin Pring
3. Finally read 'Price Action bar by bar' by Al Books (Not for casual reader).
Sir @DillikiBiili , could you please suggest a book for technical analysis ?
— Pawan Yadav (@pawan_yadav86) March 25, 2022






I curated a list on 13 examples of Weekly Bank Nifty analysis by @niki_poojary, chronologically: 🧵
0/ Tomorrow I am posting a thread on how you can make such a weekly trading plan for yourself.
Will be using this thread as an example at the end of that thread tomorrow.
Anyways, let's begin!
1/ October 2nd Week
2/ October 3rd
3/ November 1st
0/ Tomorrow I am posting a thread on how you can make such a weekly trading plan for yourself.
Will be using this thread as an example at the end of that thread tomorrow.
Anyways, let's begin!
1/ October 2nd Week
#BANKNIFTY
— Nikita Poojary (@niki_poojary) October 10, 2021
Outlook for the week Oct 11 - Oct 14, 2021
Compiled here\U0001f447
2/ October 3rd
#BANKNIFTY
— Nikita Poojary (@niki_poojary) October 17, 2021
Outlook for the week Oct 18 - Oct 21, 2021
Clear BO on the Weekly TF
1/4 pic.twitter.com/oh7F1AEsH7
3/ November 1st
#BANKNIFTY
— Nikita Poojary (@niki_poojary) October 31, 2021
Outlook for the truncated week Nov 1- Nov 3, 2021
On a higher TF structure has changed to -ve, bounces would be utilized as a selling opportunity
However this is the first selling so first pullback can be expected
Detailed explanation on the charts pic.twitter.com/7UxQBZ3QFq