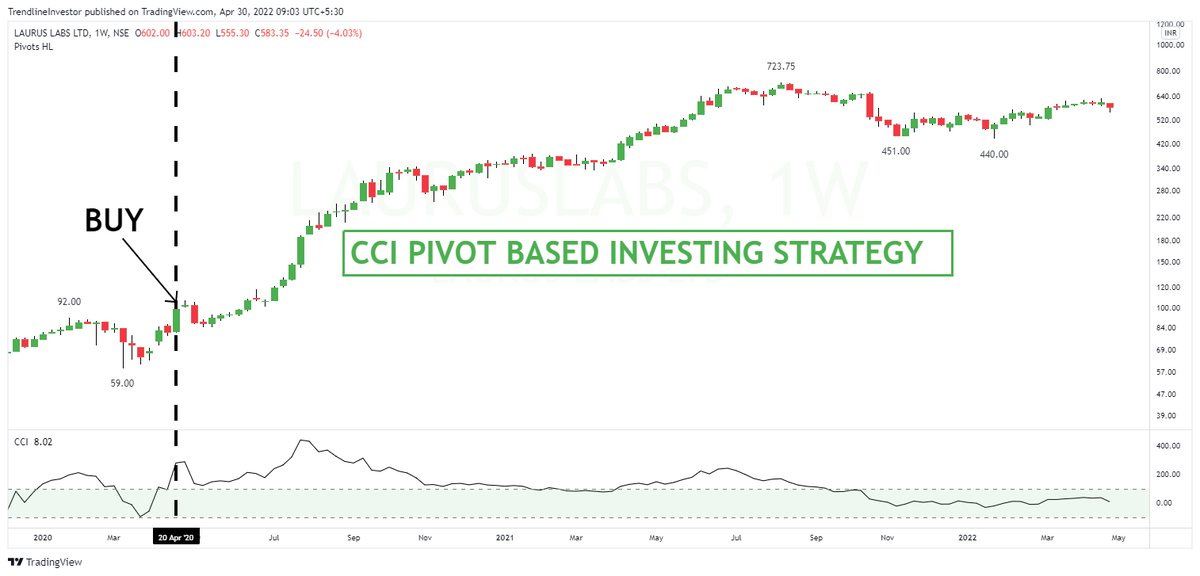
• CCI > 100 = Bullish and overbought
• CCI < -100 = Bearish and oversold


There are 1000s of indicators in Technical Analysis...
— Trendline Investor (@dmdsplyinvestor) May 12, 2022
But you need to MASTER ONLY ONE\U0001f3afto win in markets...
I selected 'Commodity channel index' (CCI) as my PRIMARY INDICATOR & all my scanners are a variation of this...
MULTI TIMEFRAME POSITIONAL STRATEGY using CCI...\U0001f9f5 pic.twitter.com/4O2PrBxSw9

I think it is just about time for #broking stocks to \U0001f680!
— Trendline Investor (@dmdsplyinvestor) April 4, 2022
- #AngelOne looks the strongest & near ATH
- #Isec near major trendline support, forming Dojis on weekly
- #Motilalofs near major trendline supports, forming Dojis on monthly
All three low-risk setups!#stockideas pic.twitter.com/xB3Tm9jSou
Sir, How do u find a set up - Do you track chart of each stock daily ? Or do u have filters , that lead you to a number of stocks , after which you scan them.
— AKASH GUPTA (@lockdownmurti) August 25, 2021
#CPR is an indicator which is used for #Intraday in Stock Market.
— Yash Mehta (@YMehta_) November 19, 2021
This learning thread would be on
"\U0001d650\U0001d668\U0001d65a\U0001d668 \U0001d664\U0001d65b \U0001d63e\U0001d64b\U0001d64d"
Like\u2764\ufe0f& Retweet\U0001f501for wider reach and for more such learning thread in the future.
Also, an investment strategy is shared using CPR in the end.
1/24
CPR indicator trend analysis:
— Gomathi Shankar (@cprbykgs) January 25, 2022
Candles below daily & weekly CPR \U0001f43b
Candles above daily CPR but below weekly CPR early confirmation of \U0001f402
Candles above daily + weekly CPR strong confirmation of \U0001f402
Isn\u2019t it simple?#cprbykgs #cprindicator #nifty #banknifty
#banknifty
— Gomathi Shankar (@cprbykgs) July 9, 2021
Candles above monthly CPR- Bullish
Candles above weekly CPR- Bullish
Now, whenever candles enter daily CPR range it indicates weakness of current trend & early signs of trend reversal.
So, wait for the candles to exit the daily CPR range then take the trade. (1/4) pic.twitter.com/7vaaLMCrV8