I will do either
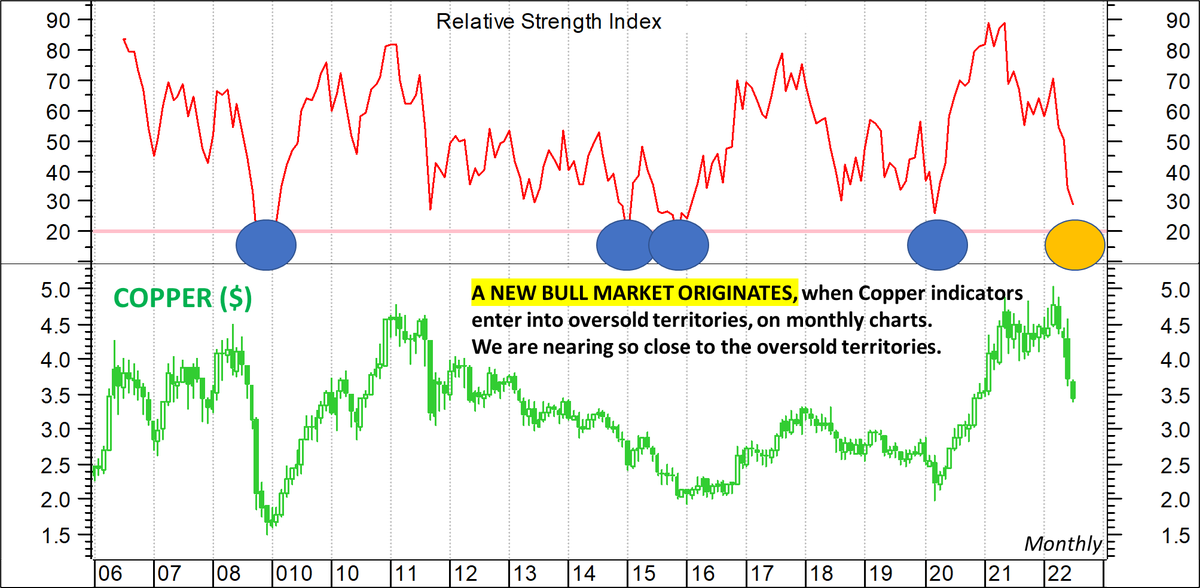
1.Monthly RSI near 40 ( presently 58)..Did nearly 20 yr backtesting
Or
2 A close above 17350 ( monthly)..This will confirm HH Structure
Levels r as of now
More from Discipline TrendFollower😀
One ( rather many) of must have scanner for traders.
Thanks brother for this & sharing it in public domain.
👍👍
Thanks brother for this & sharing it in public domain.
👍👍
As informed, this thread contains the #ChartinkScanners on the basis of which the traders can select stocks for their watchlist to trade. But nowhere is a Buy/Sell/Hold reco list. Pls Retweet for max reach. https://t.co/ezl0XffNbU
— H@\u20b9i$H \U0001f1ee\U0001f1f3 (@harrie007) June 26, 2020
How to know bottom formed?
As per classical tech analysis
Whenever daily RSI starts trading above weekly RSI. Consider it as short term bottom
When weekly RSI, above monthly RSI midium term bottom
Now daily RSI 30
Weekly 37
Monthly 59
@bankniftydoctor ..RSI king.view pl
As per classical tech analysis
Whenever daily RSI starts trading above weekly RSI. Consider it as short term bottom
When weekly RSI, above monthly RSI midium term bottom
Now daily RSI 30
Weekly 37
Monthly 59
@bankniftydoctor ..RSI king.view pl
I will do either
— Discipline TrendFollower\U0001f600 (@SouravSenguptaI) March 7, 2022
1.Monthly RSI near 40 ( presently 58)..Did nearly 20 yr backtesting
Or
2 A close above 17350 ( monthly)..This will confirm HH Structure
Levels r as of now
Simple & best one by @bankniftydoctor..Must read for momentum trader & investor..👉
I am following very simple trading plan based mainly on RSI and ADX.
— Dr.Jignesh Shah (@bankniftydoctor) January 27, 2019
Now whenever we wants to initiate trade then firstly we have to decide BIAS for direction.
BIAS based on RSI as follows-
RSI Above 55-Long.
RSI below 45-short.
RSI between 45-55\u2014- neutral.
Continue
More from Screeners




You May Also Like








On the occasion of youtube 20k and Twitter 70k members
A small tribute/gift to members
Screeners
technical screeners - intraday and positional both
before proceeding - i have helped you , can i ask you so that it can help someone else too
thank you
positional one
run - find #stock - draw chart - find levels
1- Stocks closing daily 2% up from 5 days
https://t.co/gTZrYY3Nht
2- Weekly breakout
https://t.co/1f4ahEolYB
3- Breakouts in short term
https://t.co/BI4h0CdgO2
4- Bullish from last 5
intraday screeners
5- 15 minute Stock Breakouts
https://t.co/9eAo82iuNv
6- Intraday Buying seen in the past 15 minutes
https://t.co/XqAJKhLB5G
7- Stocks trading near day's high on 5 min chart with volume BO intraday
https://t.co/flHmm6QXmo
Thank you
A small tribute/gift to members
Screeners
technical screeners - intraday and positional both
before proceeding - i have helped you , can i ask you so that it can help someone else too
thank you
positional one
run - find #stock - draw chart - find levels
1- Stocks closing daily 2% up from 5 days
https://t.co/gTZrYY3Nht
2- Weekly breakout
https://t.co/1f4ahEolYB
3- Breakouts in short term
https://t.co/BI4h0CdgO2
4- Bullish from last 5
intraday screeners
5- 15 minute Stock Breakouts
https://t.co/9eAo82iuNv
6- Intraday Buying seen in the past 15 minutes
https://t.co/XqAJKhLB5G
7- Stocks trading near day's high on 5 min chart with volume BO intraday
https://t.co/flHmm6QXmo
Thank you