Many asked me about trendfollowing ..
Pl find enclosed a general FAQ prepared earlier & I hope it could be useful
Any query is welcome
#trendfollowing
I have tried to prepare (best of my knowledge) a small FAQ on Trendfollowing. For more details you may read https://t.co/E5JE81huNA by @Covel
— Discipline TrendFollower\U0001f600 (@SouravSenguptaI) July 12, 2020
Also liberty of tagging @WeekendInvestng
& @Trendmyfriends whome, I consider as best TF in India
Slightly length..But do read it
More from Discipline TrendFollower😀
Thanks brother for this & sharing it in public domain.
👍👍
As informed, this thread contains the #ChartinkScanners on the basis of which the traders can select stocks for their watchlist to trade. But nowhere is a Buy/Sell/Hold reco list. Pls Retweet for max reach. https://t.co/ezl0XffNbU
— H@\u20b9i$H \U0001f1ee\U0001f1f3 (@harrie007) June 26, 2020
As per classical tech analysis
Whenever daily RSI starts trading above weekly RSI. Consider it as short term bottom
When weekly RSI, above monthly RSI midium term bottom
Now daily RSI 30
Weekly 37
Monthly 59
@bankniftydoctor ..RSI king.view pl
I will do either
— Discipline TrendFollower\U0001f600 (@SouravSenguptaI) March 7, 2022
1.Monthly RSI near 40 ( presently 58)..Did nearly 20 yr backtesting
Or
2 A close above 17350 ( monthly)..This will confirm HH Structure
Levels r as of now
I am following very simple trading plan based mainly on RSI and ADX.
— Dr.Jignesh Shah (@bankniftydoctor) January 27, 2019
Now whenever we wants to initiate trade then firstly we have to decide BIAS for direction.
BIAS based on RSI as follows-
RSI Above 55-Long.
RSI below 45-short.
RSI between 45-55\u2014- neutral.
Continue
You May Also Like


Mr. Patrick, one of the chief scientists at the Army Biological Warfare Laboratories at Fort Detrick in Frederick, Md., held five classified US patents for the process of weaponizing anthrax.
2/x
Under Mr. Patrick’s direction, scientists at Fort Detrick developed a tularemia agent that, if disseminated by airplane, could cause casualties & sickness over 1000s mi². In a 10,000 mi² range, it had 90% casualty rate & 50% fatality rate
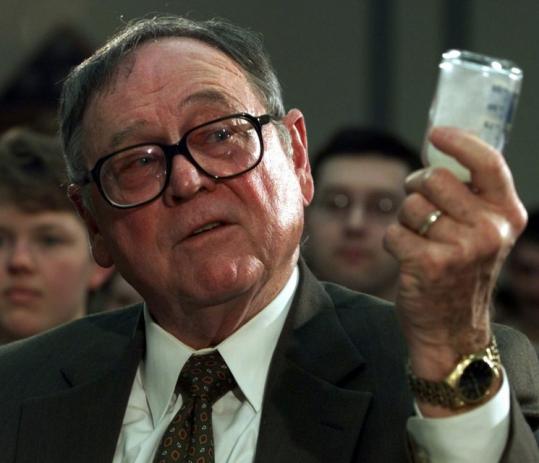
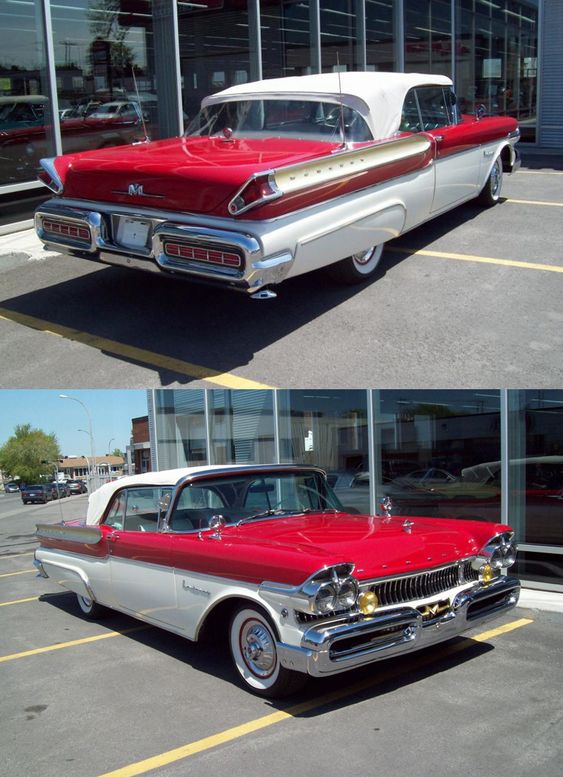
3/x His team explored Q fever, plague, & Venezuelan equine encephalitis, testing more than 20 anthrax strains to discern most lethal variety. Fort Detrick scientists used aerosol spray systems inside fountain pens, walking sticks, light bulbs, & even in 1953 Mercury exhaust pipes
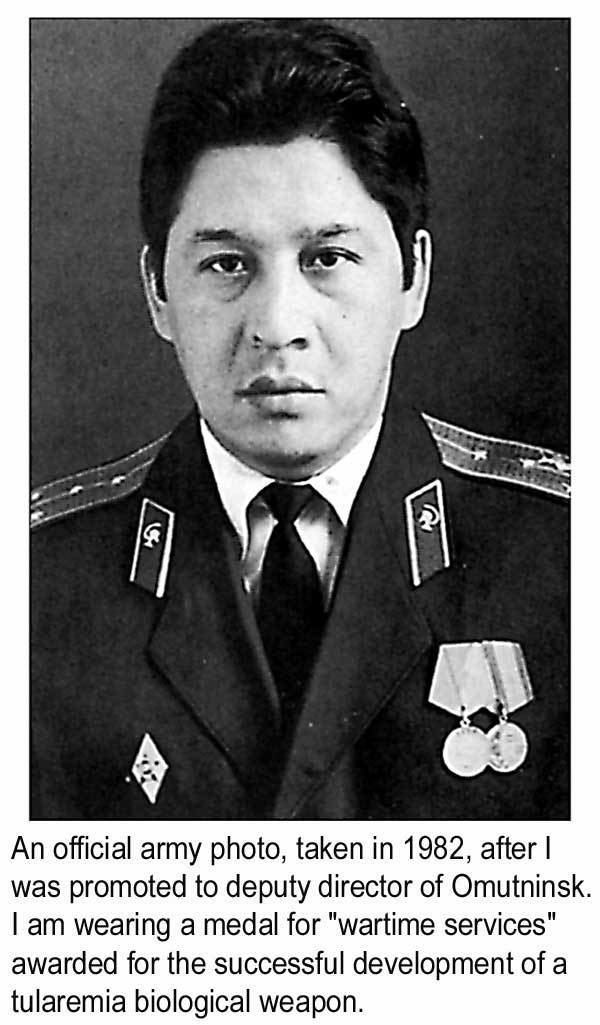
4/x After retiring in 1986, Mr. Patrick remained one of the world’s foremost specialists on biological warfare & was a consultant to the CIA, FBI, & US military. He debriefed Soviet defector Ken Alibek, the deputy chief of the Soviet biowarfare program
https://t.co/sHqSaTSqtB
5/x Back in Time
In 1949 the Army created a small team of chemists at "Camp Detrick" called Special Operations Division. Its assignment was to find military uses for toxic bacteria. The coercive use of toxins was a new field, which fascinated Allen Dulles, later head of the CIA