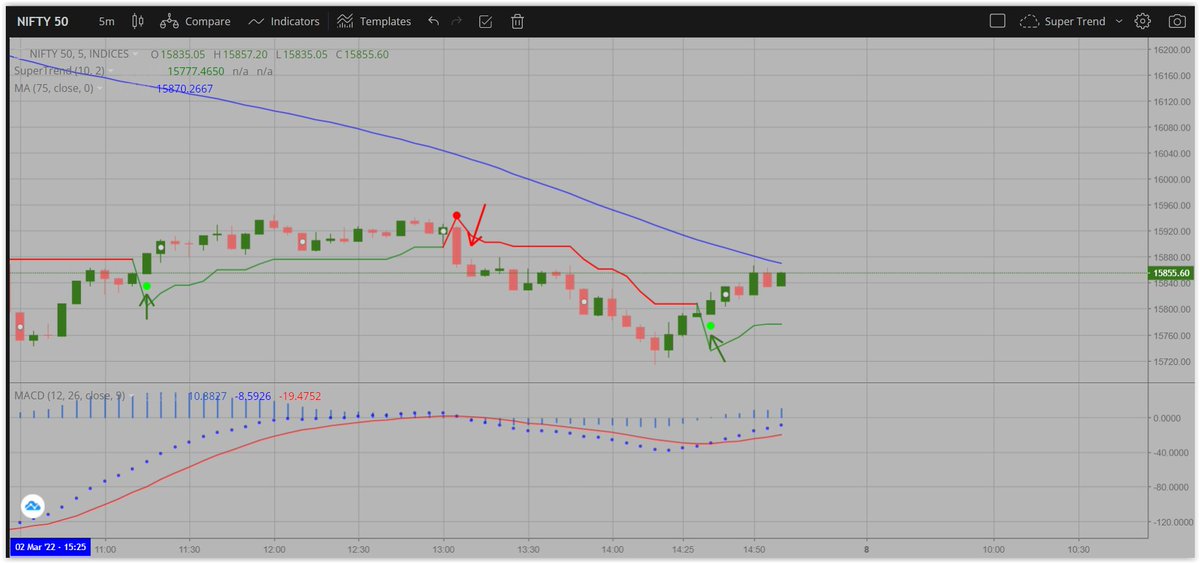
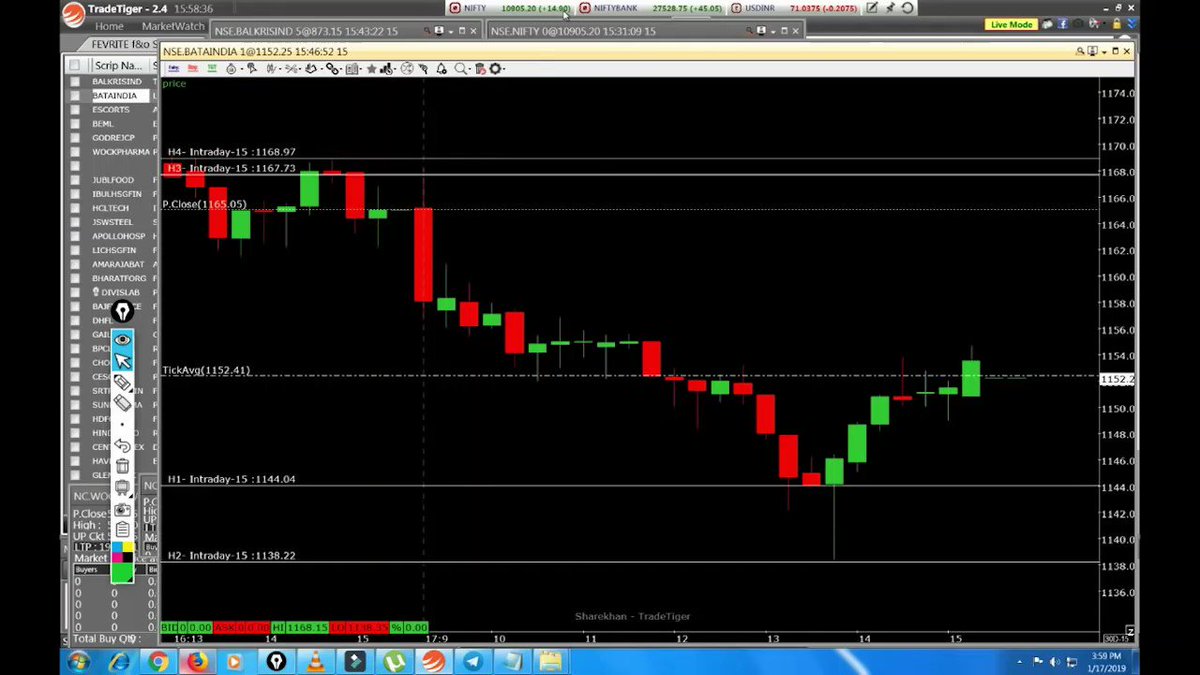
Simple trading system on such a Gap down day.
"5 Minute t/f"
with #supertrend
In this ocean, all kinds survive.
Only the egotist come out & yaps all day, how he/ she is the best.
Come to Madurai market & see the beehive of activity.
Everyone minds their own business
"Make Money"
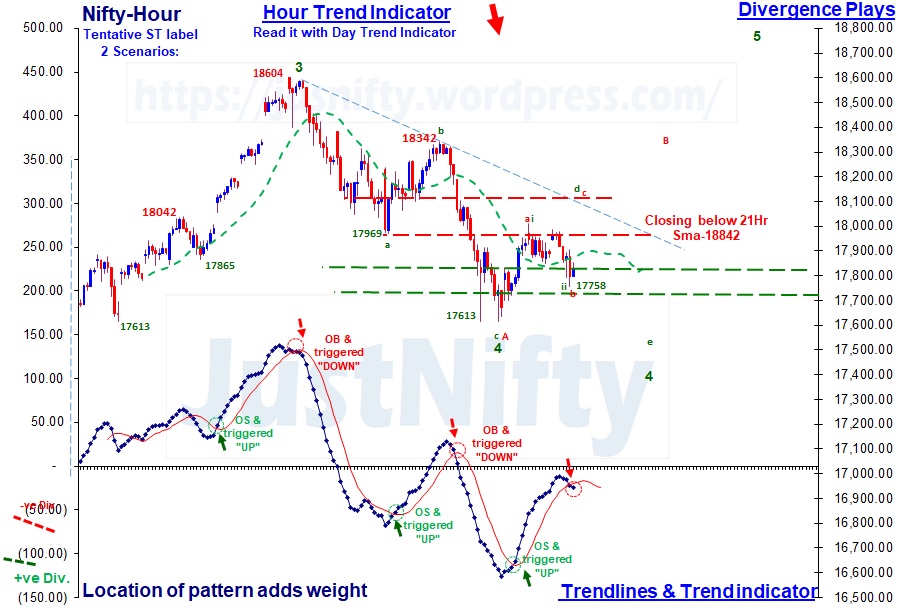
More from Van Ilango (JustNifty)
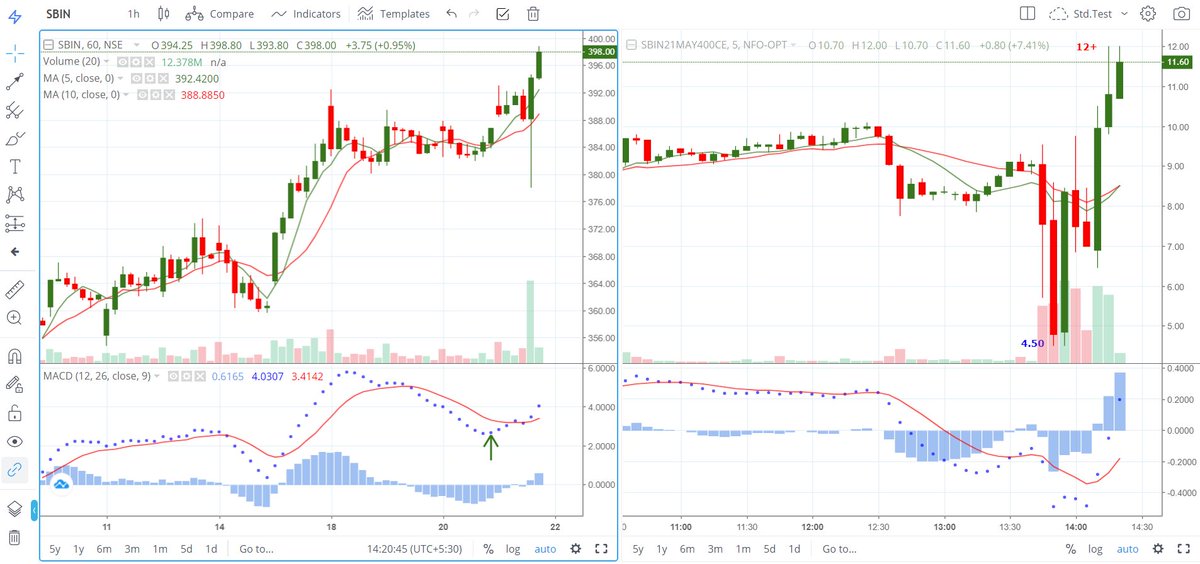
Holding 660 & 680, poised for big run in the days, weeks & months ahead.
Volume goes with rises
Thank you.\U0001f64f
— Van Ilango (JustNifty) (@JustNifty) August 18, 2021
A fresh input for you. #McDowell
A major triangle break out in the coming months.
Presently poised to move out of recent consolidation pic.twitter.com/J15F06ODUq
You ask me or any other persons, they'll tell you their subjective view however unbiased they attempt to be.
It is their view and not necessarily the market's.
My subjective view is labelled in the charts.
Follow #Priceaction https://t.co/37iXFtWPzU
Currently reading the book you put on your website. Also, from this if we consider 18600 as 5 th wave end of Nifty ideally it's doing the 1st 12345 of downtrend, of which do e already 1234, currently going towards 5 which I believe should go below 100% of 4th retracement wave
— de soloist \U0001f1ee\U0001f1f3 (@ChakiArijit) November 4, 2021
Remembered it & made entry @ open for the "High rewarding 3rd wave"
Much appreciation🙏 to @ap_pune for his regular sharing of vital info. & wisdom from years of experience.
#auropharma "Hour t/f" for "Traders"
— Van Ilango (JustNifty) (@JustNifty) March 21, 2022
In search of the highly rewarding 2nd wave entry.
Today's & tomorrow's #priceaction would have more clarity for entry either @ 615-620 or above 655 https://t.co/20S0Lvc7ej pic.twitter.com/OFlf9MLkqz

More from Screeners


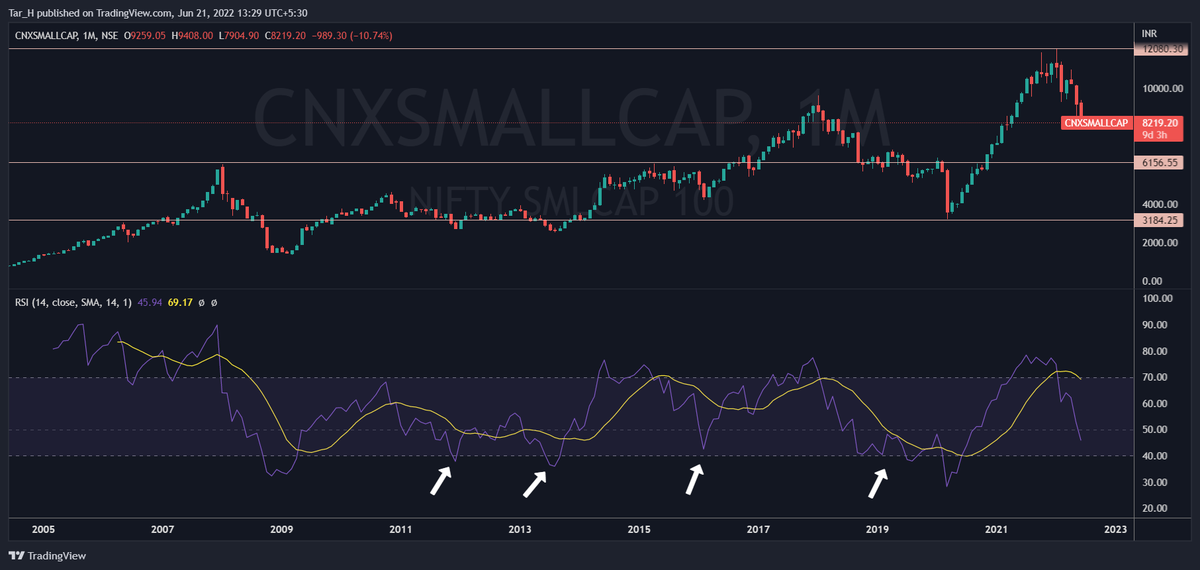
Take small cap index for example
Whenever Monthly RSI is below or around 40, the index bottoms out
We are getting there.
If I had 50% cash, I would have deployed some in beaten down stocks where earnings growth is intact. https://t.co/t5WwgH1V5o
I have more than 50% cash but still worried if this is a good time. Will invest 20% by EoY
— Tamil Metaverse (@TamilMetaverse) June 21, 2022


You May Also Like


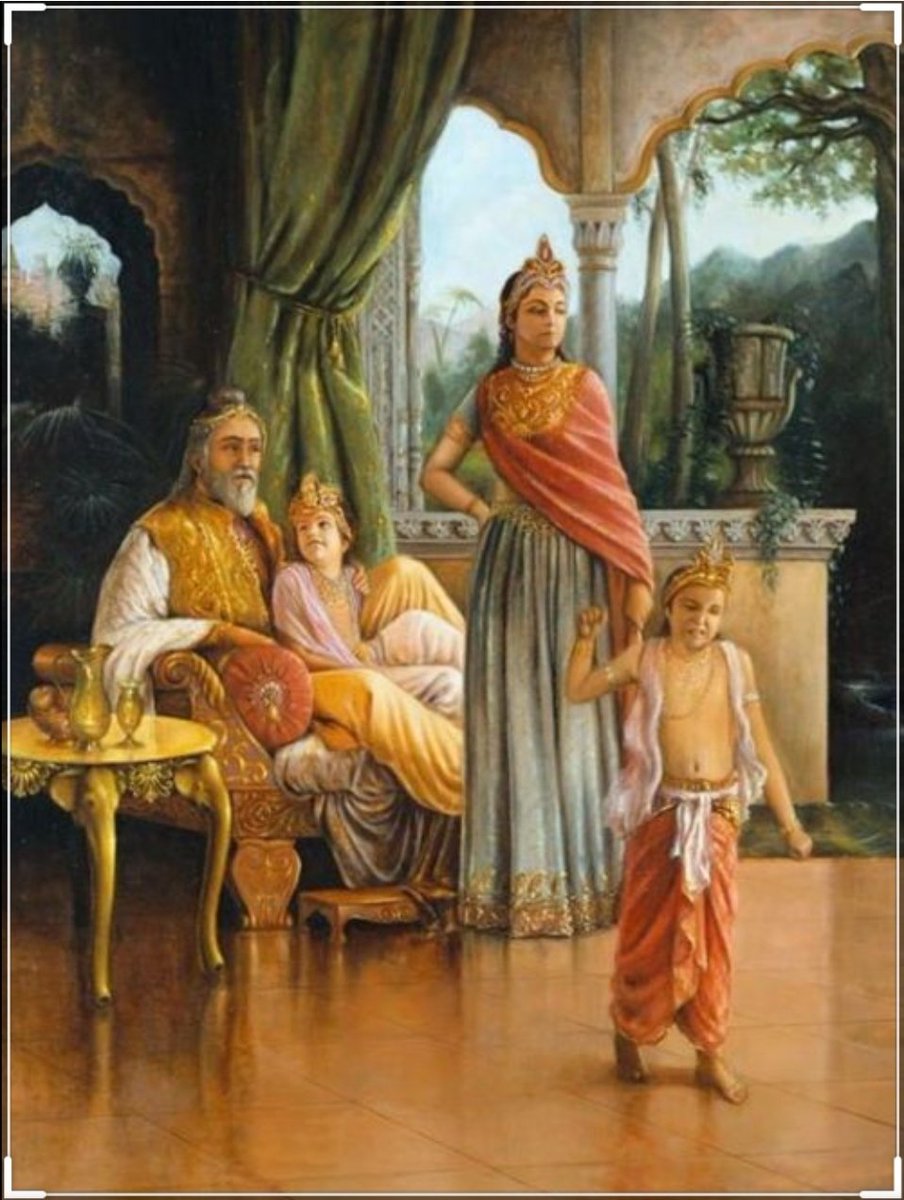
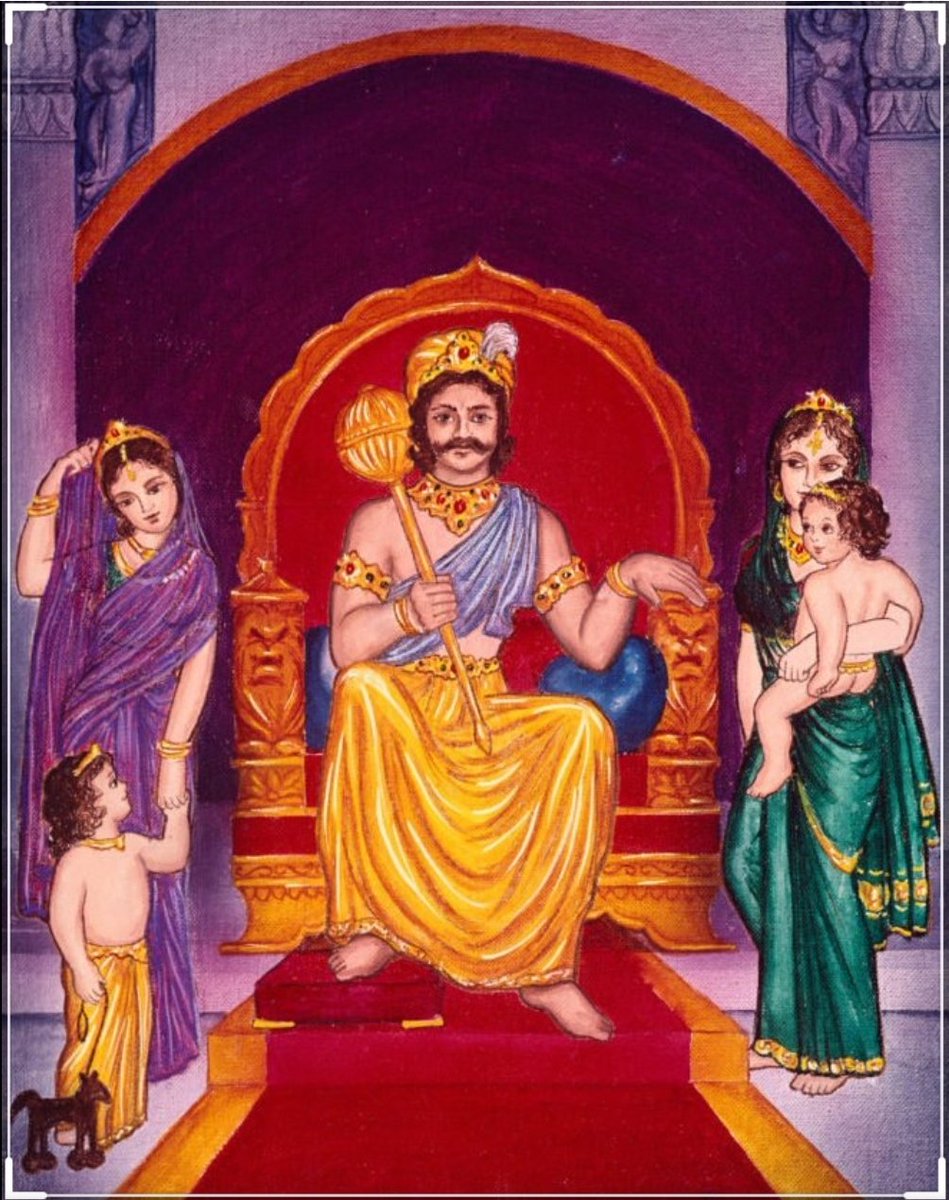
Once upon a time there was a Raja named Uttānapāda born of Svayambhuva Manu,1st man on earth.He had 2 beautiful wives - Suniti & Suruchi & two sons were born of them Dhruva & Uttama respectively.
#talesofkrishna https://t.co/E85MTPkF9W
Prabhu says i reside in the heart of my bhakt.
— Right Singh (@rightwingchora) December 21, 2020
Guess the event. pic.twitter.com/yFUmbfe5KL
Now Suniti was the daughter of a tribal chief while Suruchi was the daughter of a rich king. Hence Suruchi was always favored the most by Raja while Suniti was ignored. But while Suniti was gentle & kind hearted by nature Suruchi was venomous inside.
#KrishnaLeela
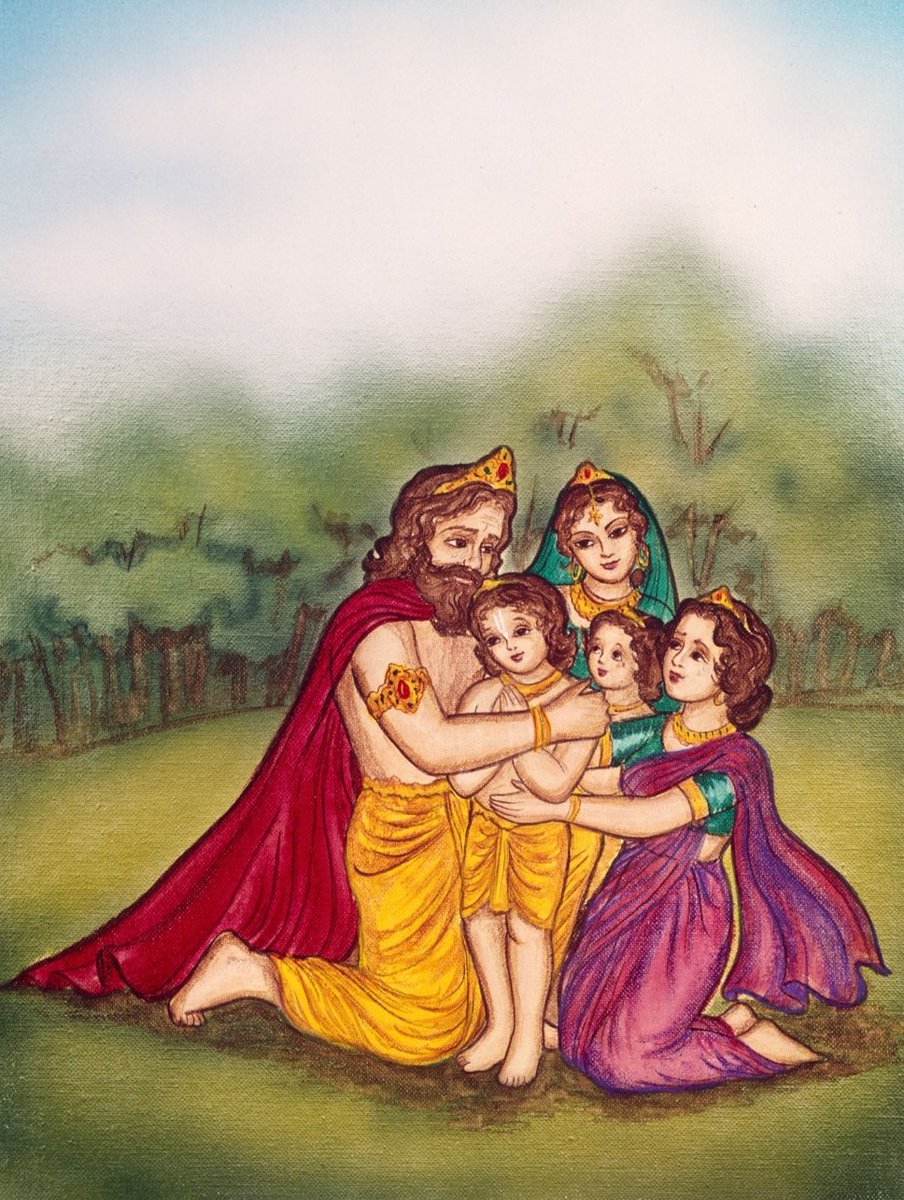
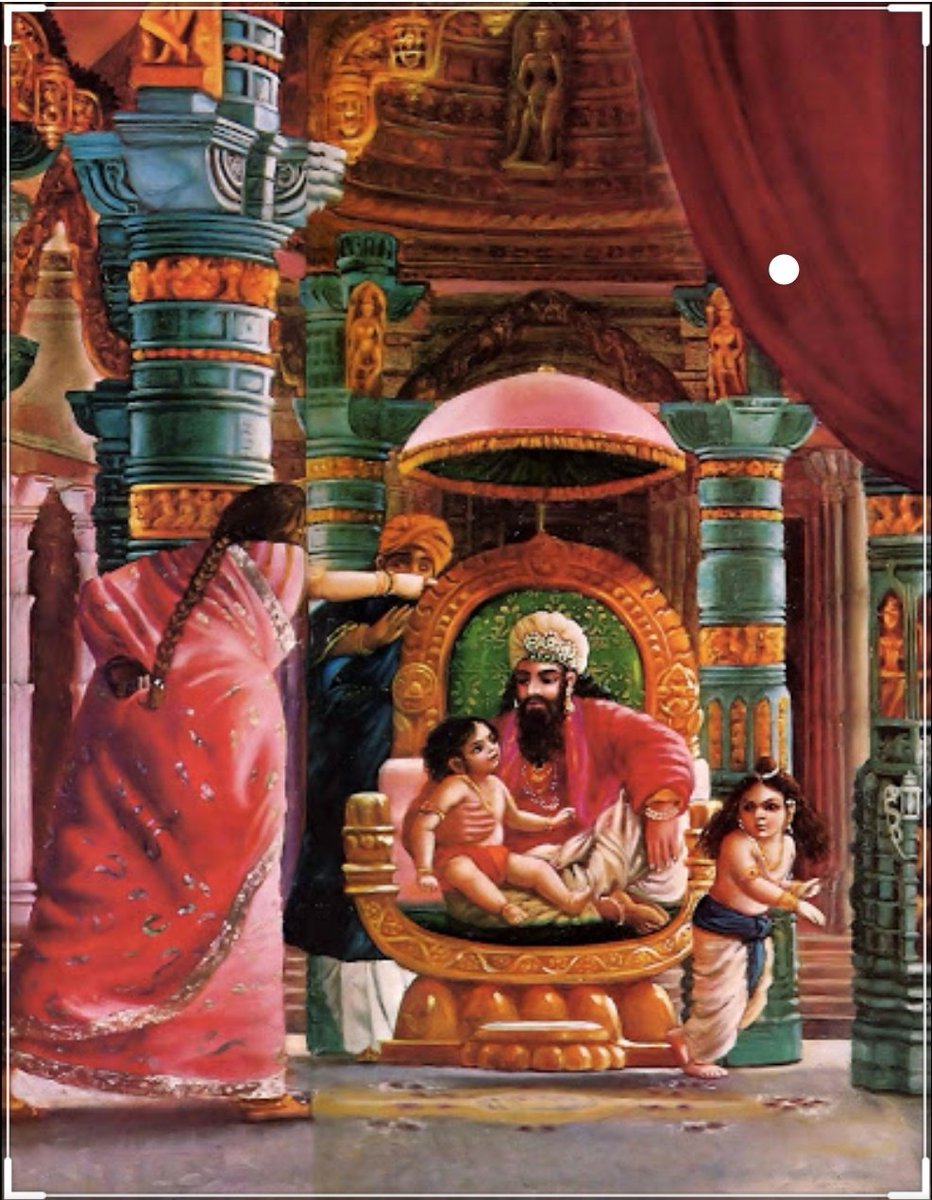
The story is of a time when ideally the eldest son of the king becomes the heir to the throne. Hence the sinhasan of the Raja belonged to Dhruva.This is why Suruchi who was the 2nd wife nourished poison in her heart for Dhruva as she knew her son will never get the throne.
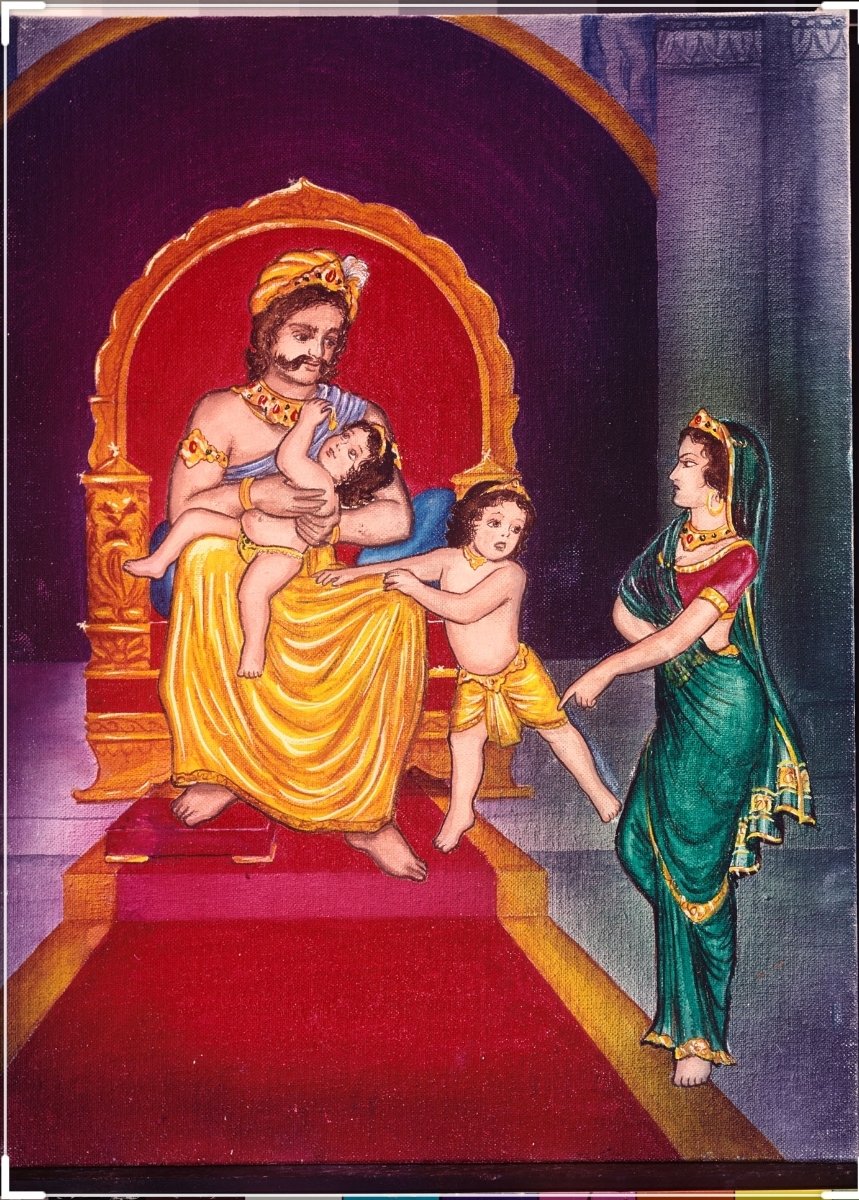
One day when Dhruva was just 5 years old he went on to sit on his father's lap. Suruchi, the jealous queen, got enraged and shoved him away from Raja as she never wanted Raja to shower Dhruva with his fatherly affection.
Dhruva protested questioning his step mother "why can't i sit on my own father's lap?" A furious Suruchi berated him saying "only God can allow him that privilege. Go ask him"