
#bajfinance
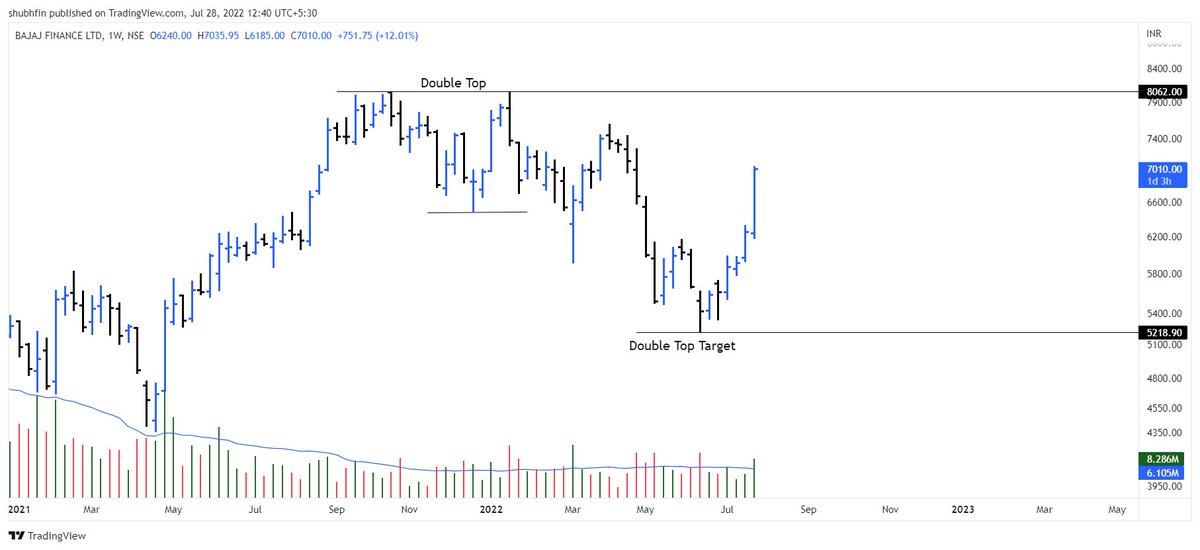
An "ABC" correction ended & "C" wave's "12345" ended in this highly traded stock.
#Elliottwave captures Nature's law, human actions in a collective way
and,
in Top gainers' https://t.co/9bw8A0tgUp
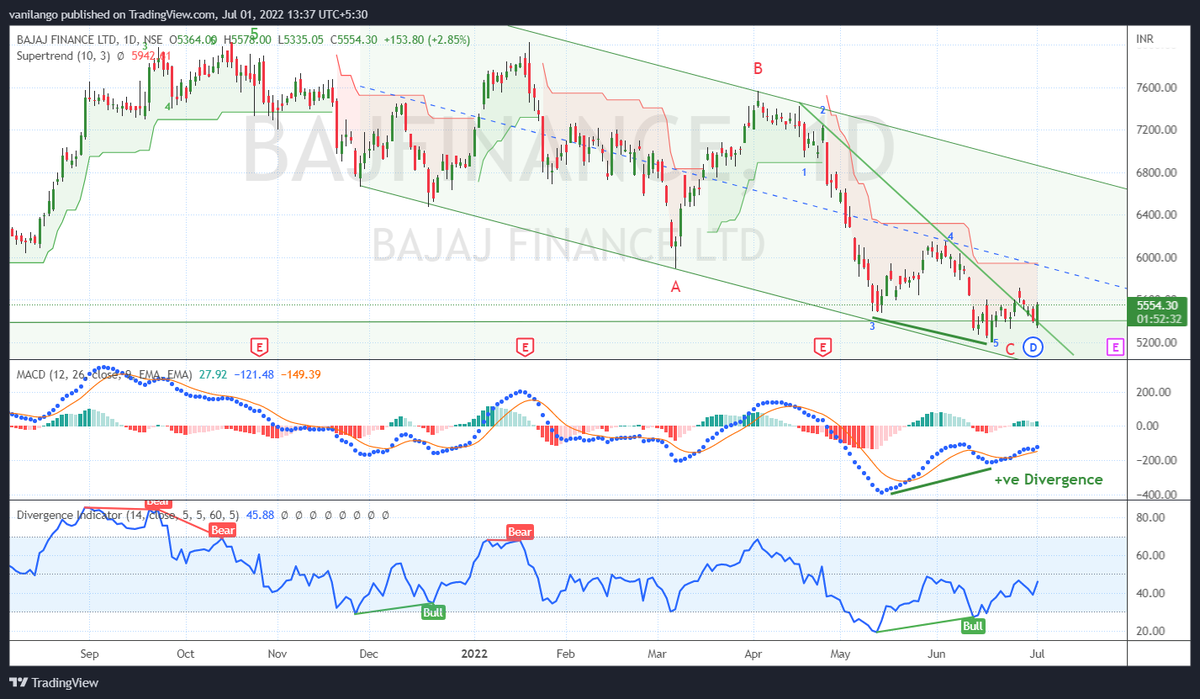
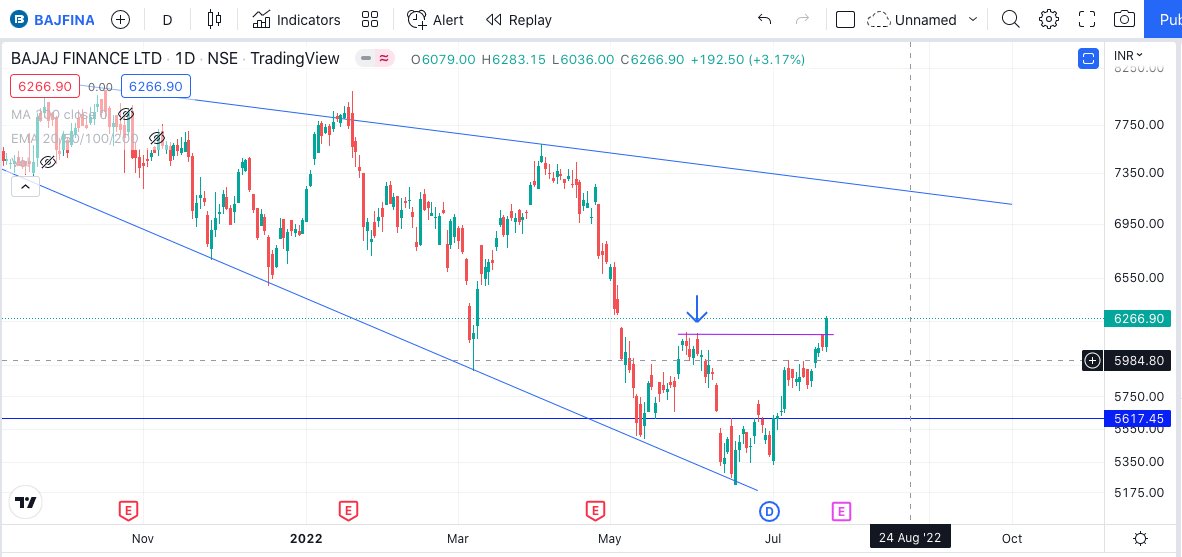
#bajfinance is almost @ sloping channel bottom & has entered the demand zone.
— Van ilango (JustNifty) (@JustNifty) June 22, 2022
One of few stocks that are displaying +ve #Divergence in "Day t/f"
"ABC" correction "almost" done.
Above 5650, mild strength. https://t.co/IJlQ0GKtN3 pic.twitter.com/4uqY0DRqiW
More from Van ilango (JustNifty)
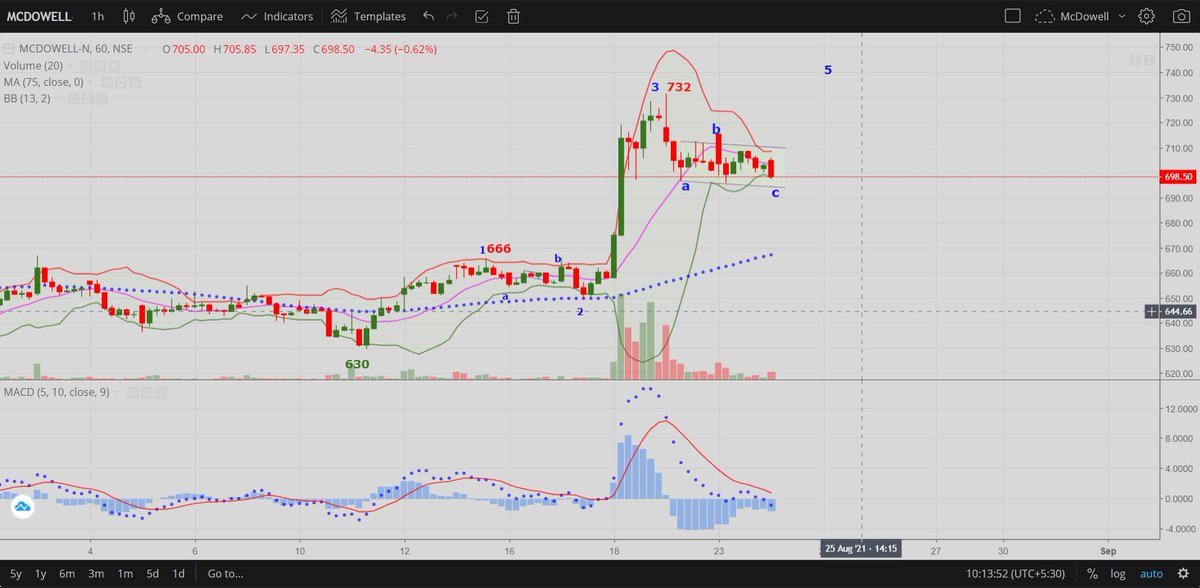
Holding 660 & 680, poised for big run in the days, weeks & months ahead.
Volume goes with rises
Thank you.\U0001f64f
— Van Ilango (JustNifty) (@JustNifty) August 18, 2021
A fresh input for you. #McDowell
A major triangle break out in the coming months.
Presently poised to move out of recent consolidation pic.twitter.com/J15F06ODUq
2 Strategies I liked:
1. Plot ATM week CE/PE charts with VWAP & OI Change. Buy when prices move past VWAP while OI starts to move down.
2. Plot ATM Mth CE/ PE with AVWAP. If above, buy wk CE/PE
master can you give few key points in english. Saw the entire video with subtitles but did not understand.
— bala (@BalaThink) March 13, 2022
I'll go with 5th is getting done soon.
There is one more possibility that 3rd wave is sub-dividing !!
IF so it must hold last rise #retracement https://t.co/a6BBHIWrZk
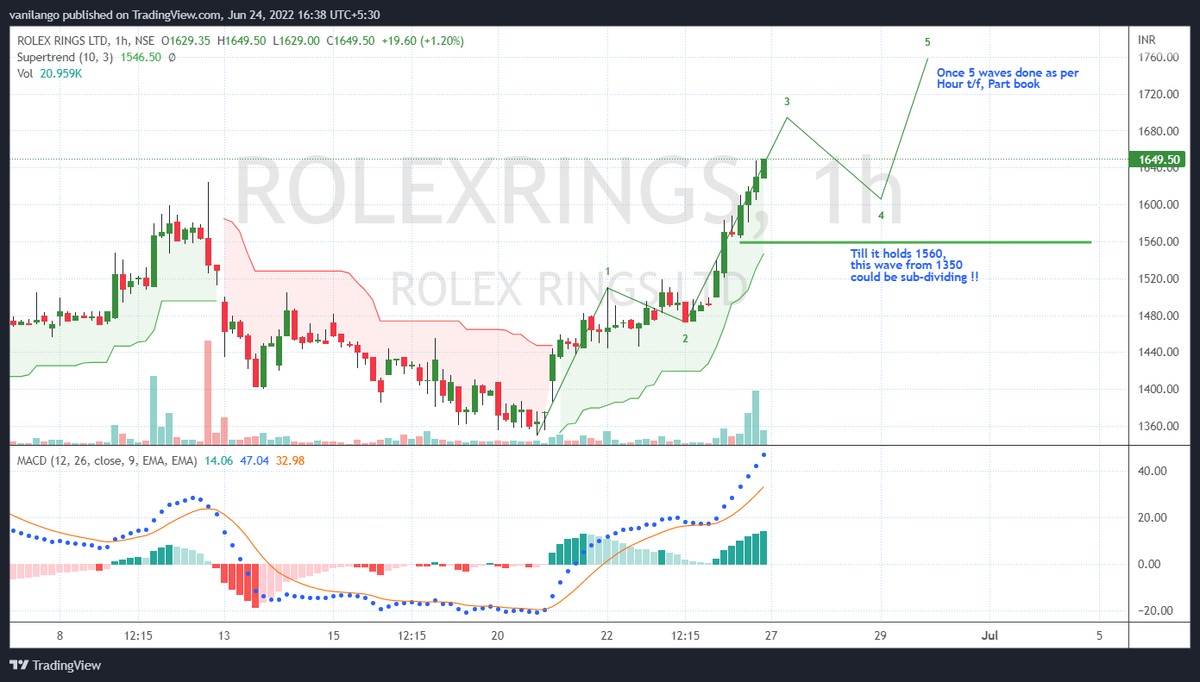
ROLEX RINGS
— manav (@manav1418) June 24, 2022
Elliot counts (possible scenario's)
Which wave count is correct as per you\U0001f64f
please guide....!!@nakulvibhor @nishkumar1977 @JustNifty @piyushchaudhry @KrunallThakkar pic.twitter.com/h97J8Ycuf5
More from Bajajfinancelongterm

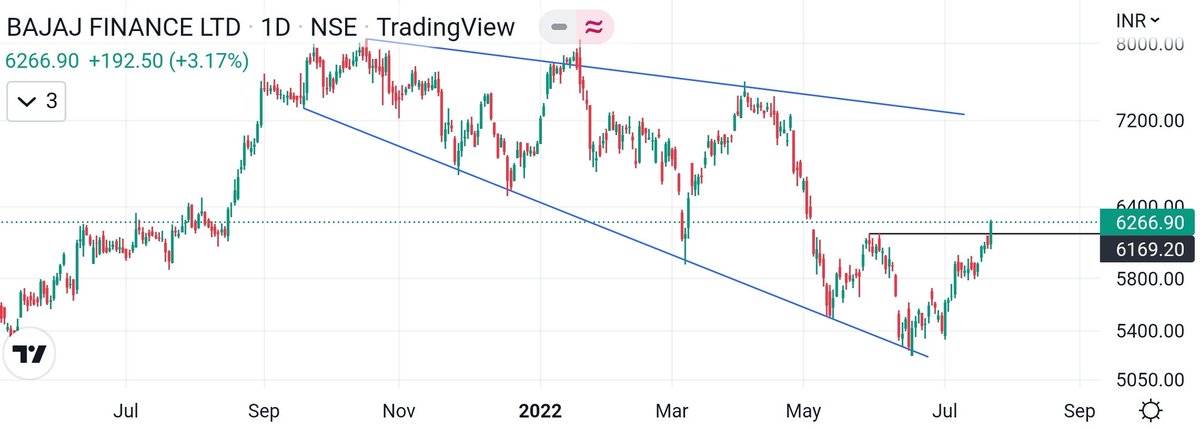

Was looking at #BajajFinance chart once again. I am not able to complete 5 waves yet...hmmm...\U0001f928
— Harsh / \ud5c8\uc26c (@_Harsh_Mehta_) June 17, 2022
As posted earlier, the drop is still 4th (invalidation below 4500).
And target still remains open for 10K+ https://t.co/DozJzNhuuI pic.twitter.com/jPRaEQoPH3



You May Also Like






This New York Times feature shows China with a Gini Index of less than 30, which would make it more equal than Canada, France, or the Netherlands. https://t.co/g3Sv6DZTDE
That's weird. Income inequality in China is legendary.
Let's check this number.
2/The New York Times cites the World Bank's recent report, "Fair Progress? Economic Mobility across Generations Around the World".
The report is available here:
3/The World Bank report has a graph in which it appears to show the same value for China's Gini - under 0.3.
The graph cites the World Development Indicators as its source for the income inequality data.
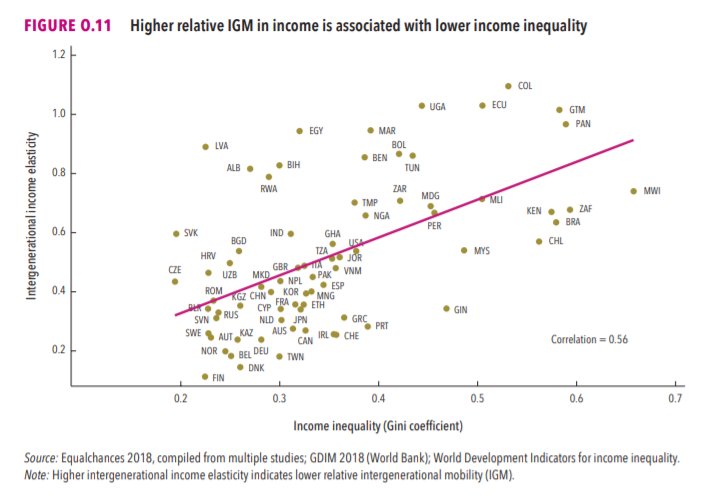
4/The World Development Indicators are available at the World Bank's website.
Here's the Gini index: https://t.co/MvylQzpX6A
It looks as if the latest estimate for China's Gini is 42.2.
That estimate is from 2012.
5/A Gini of 42.2 would put China in the same neighborhood as the U.S., whose Gini was estimated at 41 in 2013.
I can't find the <30 number anywhere. The only other estimate in the tables for China is from 2008, when it was estimated at 42.8.

