Inside Bar - Target & Stop Loss
Hello everyone,
Here, I have made a video of an Inside bar trading strategy part 2 which has 90% accuracy.
Save the screener for checking stocks every day
Learn to identify Target & Stop Loss -
More from Vibhor Varshney
irctc
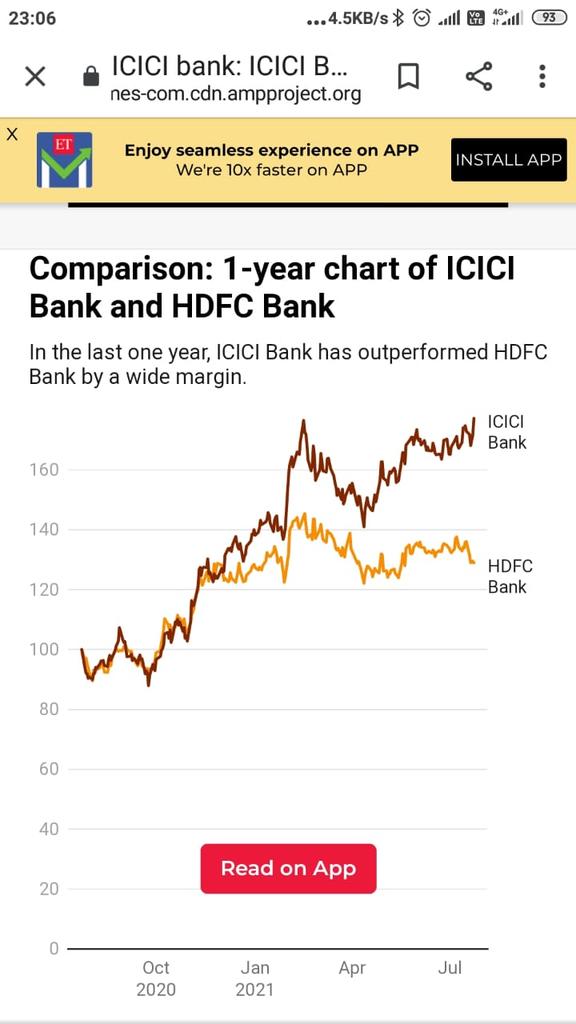
approching upper trendine , might took a small pause or need to break resistance with good volumes
target was 2900 , made high 2897 , with just 3 points short.
booking some positions as reached near resistance , will add near supportive trendline,
holding rest for 3600 https://t.co/2H0myGPgu5
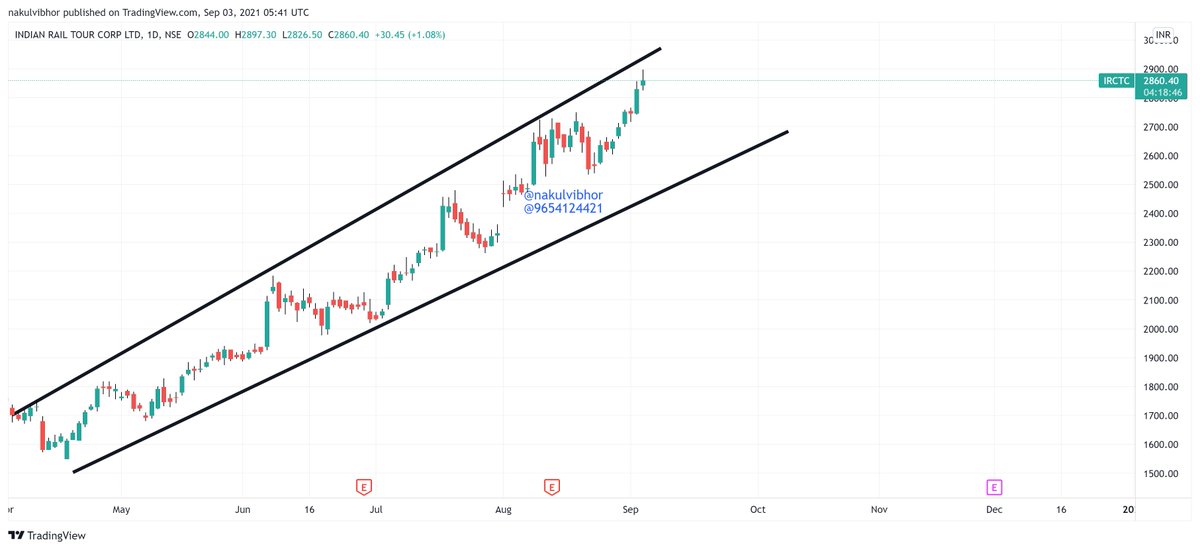
approching upper trendine , might took a small pause or need to break resistance with good volumes
target was 2900 , made high 2897 , with just 3 points short.
booking some positions as reached near resistance , will add near supportive trendline,
holding rest for 3600 https://t.co/2H0myGPgu5
Itctc
— Vibhor Varshney (@nakulvibhor) September 2, 2021
Entered 2800 \u2705
Heading towards 2900 target
Then 3600
Holding personally in folio \U0001f44d https://t.co/jd2OOQTSLs
More from Screeners



If you’ve opened your Zerodha account recently, you may not know about some of the cool features we have across all the Zerodha products and platforms.
A thread on some features that will help you trade and invest better😀👇
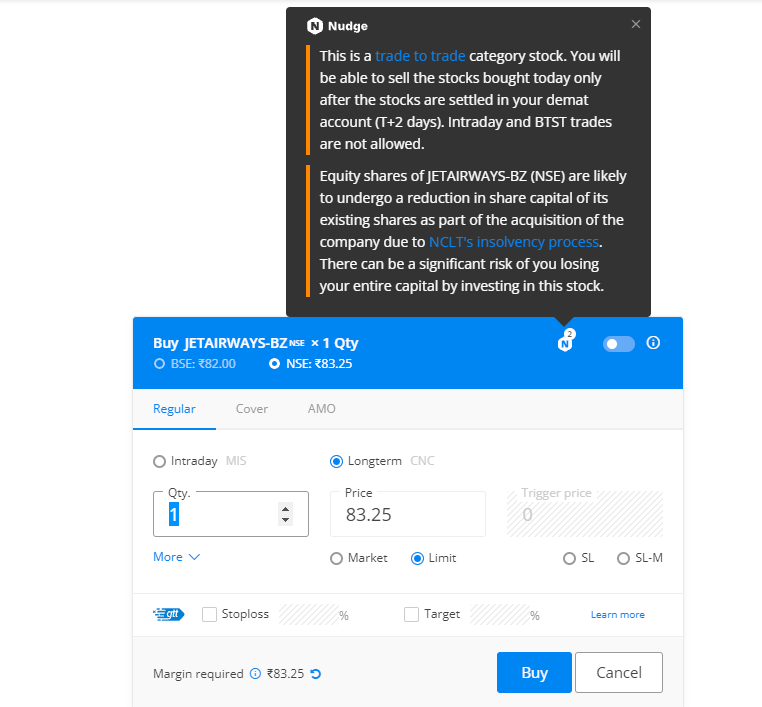
With Nudges, our aim is to help users avoid mistakes at the point of decision-making. We’ll nudge you when you’re about to make a mistake like buy dubious stocks, trade illiquid scrips, stocks with corporate actions etc. Here are a few Nudges that have helped users the most👇
With GTT, you can place long-standing orders. You can place a target and a stop loss for the stocks you buy so that you don’t have to track the prices every day. The orders will remain active until triggered*🏖
If you trade large quantities of scrips with freeze quantity, for example, you'll have to open the order window each time. With sticky order window, the order form remains open even after you place an order so that you can quickly place multiple
With the Positions Analysis tool by @BeSensibull, you can see Max loss, Max profit, Breakeven probability of profit, Greeks, IVs and much more right on Kite.
You can also change the price and expiry to see how much you'll gain or lose.
A thread on some features that will help you trade and invest better😀👇
With Nudges, our aim is to help users avoid mistakes at the point of decision-making. We’ll nudge you when you’re about to make a mistake like buy dubious stocks, trade illiquid scrips, stocks with corporate actions etc. Here are a few Nudges that have helped users the most👇
With GTT, you can place long-standing orders. You can place a target and a stop loss for the stocks you buy so that you don’t have to track the prices every day. The orders will remain active until triggered*🏖
If you trade large quantities of scrips with freeze quantity, for example, you'll have to open the order window each time. With sticky order window, the order form remains open even after you place an order so that you can quickly place multiple
Normally after you place an order, the order window closes. With the Sticky order window, the order window remains open, making it easy to place multiple orders with the same input with just one click\u26a1rather than doing it all over again. This helps overcome qty freeze limits. pic.twitter.com/65kXY4h9f0
— Zerodha (@zerodhaonline) November 15, 2021
With the Positions Analysis tool by @BeSensibull, you can see Max loss, Max profit, Breakeven probability of profit, Greeks, IVs and much more right on Kite.
You can also change the price and expiry to see how much you'll gain or lose.


You May Also Like





1/OK, data mystery time.
This New York Times feature shows China with a Gini Index of less than 30, which would make it more equal than Canada, France, or the Netherlands. https://t.co/g3Sv6DZTDE
That's weird. Income inequality in China is legendary.
Let's check this number.
2/The New York Times cites the World Bank's recent report, "Fair Progress? Economic Mobility across Generations Around the World".
The report is available here:
3/The World Bank report has a graph in which it appears to show the same value for China's Gini - under 0.3.
The graph cites the World Development Indicators as its source for the income inequality data.

4/The World Development Indicators are available at the World Bank's website.
Here's the Gini index: https://t.co/MvylQzpX6A
It looks as if the latest estimate for China's Gini is 42.2.
That estimate is from 2012.
5/A Gini of 42.2 would put China in the same neighborhood as the U.S., whose Gini was estimated at 41 in 2013.
I can't find the <30 number anywhere. The only other estimate in the tables for China is from 2008, when it was estimated at 42.8.
This New York Times feature shows China with a Gini Index of less than 30, which would make it more equal than Canada, France, or the Netherlands. https://t.co/g3Sv6DZTDE
That's weird. Income inequality in China is legendary.
Let's check this number.
2/The New York Times cites the World Bank's recent report, "Fair Progress? Economic Mobility across Generations Around the World".
The report is available here:
3/The World Bank report has a graph in which it appears to show the same value for China's Gini - under 0.3.
The graph cites the World Development Indicators as its source for the income inequality data.
4/The World Development Indicators are available at the World Bank's website.
Here's the Gini index: https://t.co/MvylQzpX6A
It looks as if the latest estimate for China's Gini is 42.2.
That estimate is from 2012.
5/A Gini of 42.2 would put China in the same neighborhood as the U.S., whose Gini was estimated at 41 in 2013.
I can't find the <30 number anywhere. The only other estimate in the tables for China is from 2008, when it was estimated at 42.8.