Gold taking bounce from support ! https://t.co/sPIay6edQU
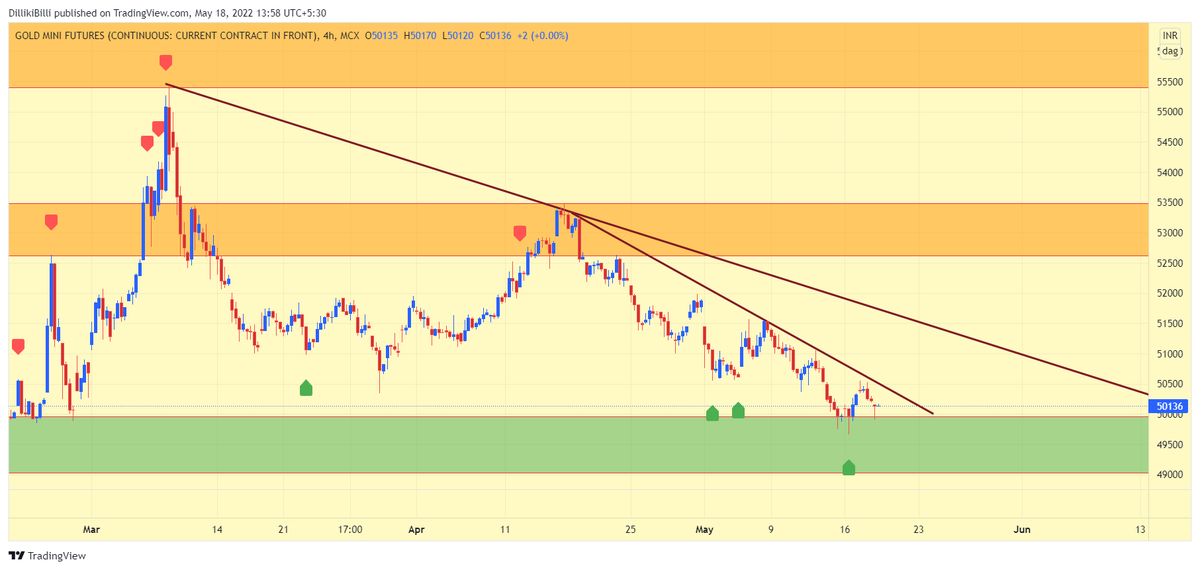
Gold is down for now, but every time demand is coming from the support zone.
— Professor (@DillikiBiili) May 8, 2022
I am bullish on Gold for long terms, as per me it would break its ATH resistance, my expected target is BRN of USD 3K/Oz. https://t.co/XT1l48pEx5 pic.twitter.com/8ViSeIPDzN
More from Professor
Lest some charlie jumps to point out, let me make it clear that I haven't invented anything in stock market, all my knowledge of stock market comes from old farts. Just my observation is my own. https://t.co/uHNw8tV4AO
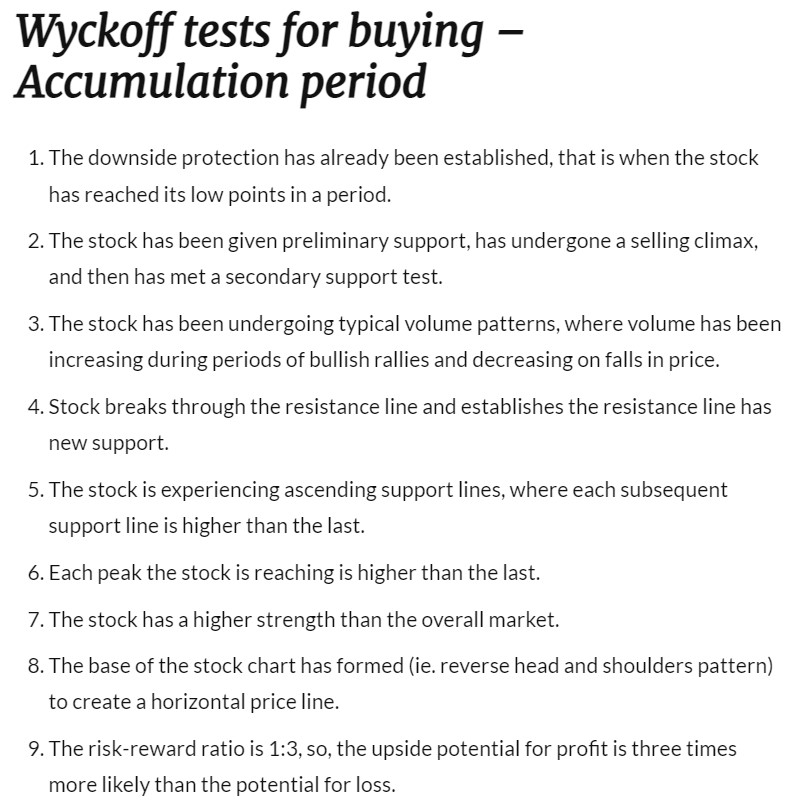
Plz advice how to identify accumulation and distribution phase...... to me Both looks same
— VIVEK VAID (@bobvaid) February 12, 2022
Here I will share what I believe are essentials for anybody who is interested in stock markets and the resources to learn them, its from my experience and by no means exhaustive..
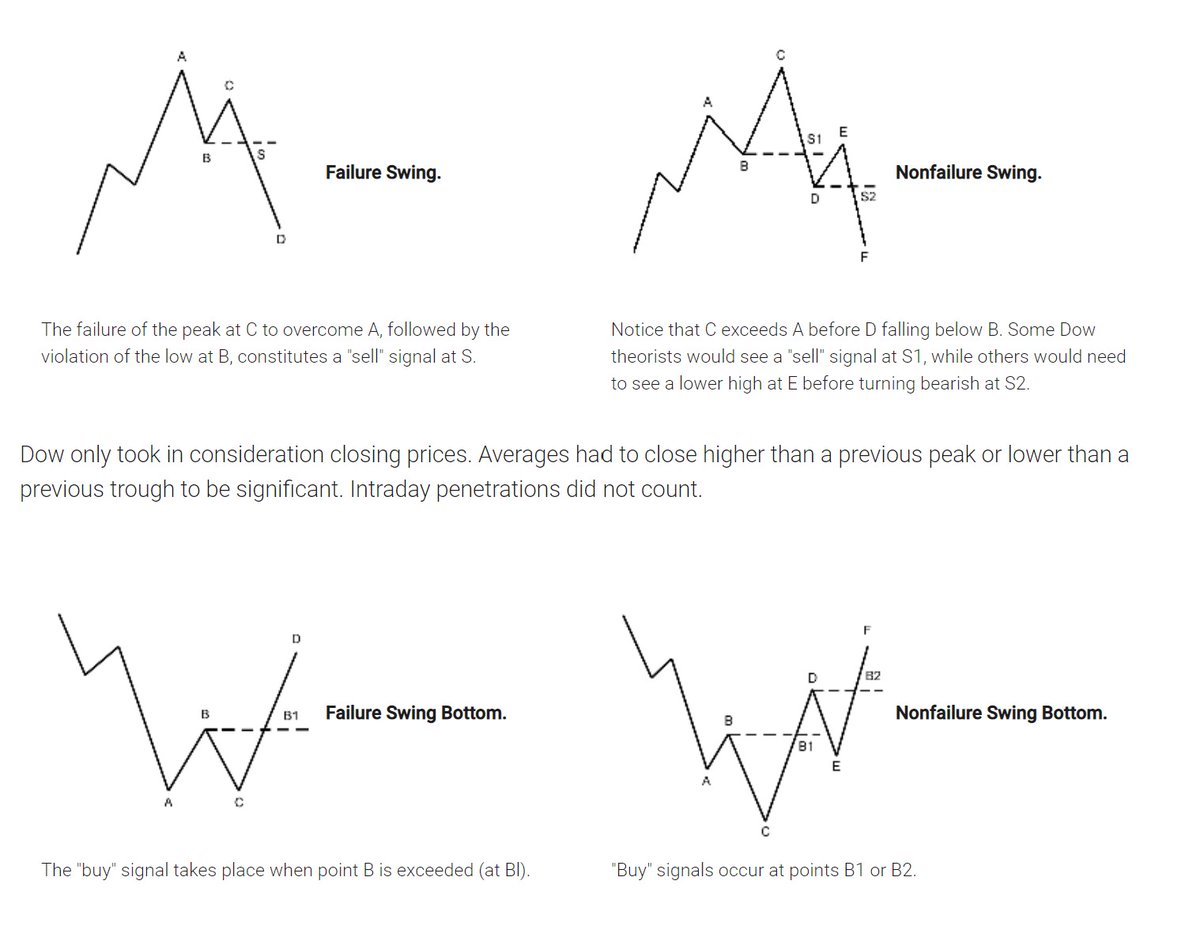
First the very basic : The Dow theory, Everybody must have basic understanding of it and must learn to observe High Highs, Higher Lows, Lower Highs and Lowers lows on charts and their
Even those who are more inclined towards fundamental side can also benefit from Dow theory, as it can hint start & end of Bull/Bear runs thereby indication entry and exits.
Next basic is Wyckoff's Theory. It tells how accumulation and distribution happens with regularity and how the market actually
Dow theory is old but
Old is Gold....
— Professor (@DillikiBiili) January 23, 2020
this Bharti Airtel chart is a true copy of the Wyckoff Pattern propounded in 1931....... pic.twitter.com/tQ1PNebq7d
As per Normal Distribution 68% of the time movement is with 1% SD Limits.
For 95% pf the times movement is within 2% SD limits.
And its only 0.3% of the times that movement exceeds 3 SD.
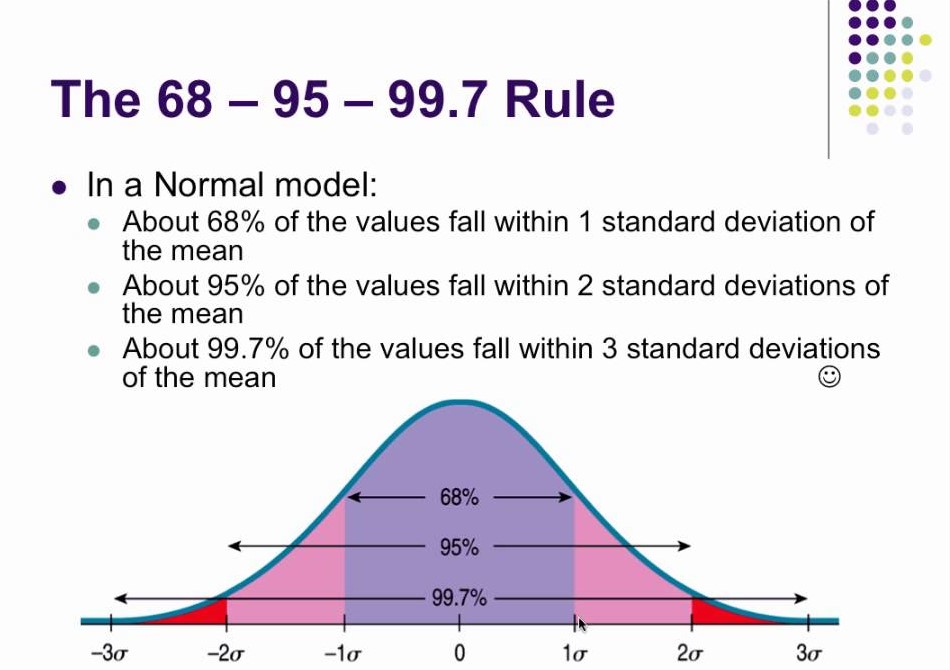
Since 95% covers a lot of ground that's why 2SD is considered to be a a safe range for most events.
The farther we move from the average, chances of occurrence go down. This is what Taleb sahab calls Tail risk, because it lies in the tail of the standard distribution curve.
Normal distribution occurs everywhere. See this
The Galton Machine shows order from randomness. Each ball bounces left or right at random, 12 times, but together where they fall can be predicted - the normal distribution. This one made by: https://t.co/oI9wOGq7nG pic.twitter.com/VQtVu66OSE
— Tom Stafford (@tomstafford) April 19, 2018
Bollinger Band, which is a very popular indicator has a setting of 2SD. Because its expected that 95% of the time moves will be confined to 2SD limits.
When we say that price is at upper/lower Bollinger band, we are saying that it has reached 2 SD limits and likely to reverse.
Now coming to current scenario, open Nifty daily chart and apply two bollinger Bands on it.
First with default setting and in second change settings to 3 standard deviation.
Crossing 3 SD boundary means that Nifty is now in very rare territory where it has been only 0.3%
1. Darvas Box System
2. ATR based trailing
3. PSAR based trailing
4. EMA Crossover based trailing
Okay sir but dusre konse method se exit ya profit book kar sakte hai sir sry apako bohot pareshan kar raha hu but sry sir
— learner \u2600\ufe0f\u2600\ufe0f (@darvaxfan1845) March 12, 2022