
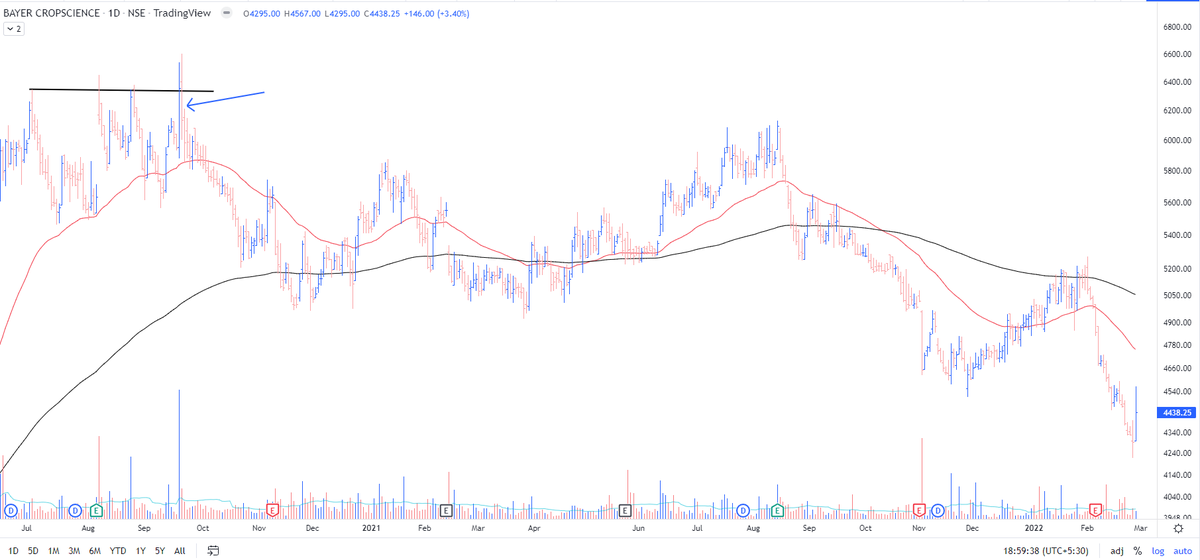
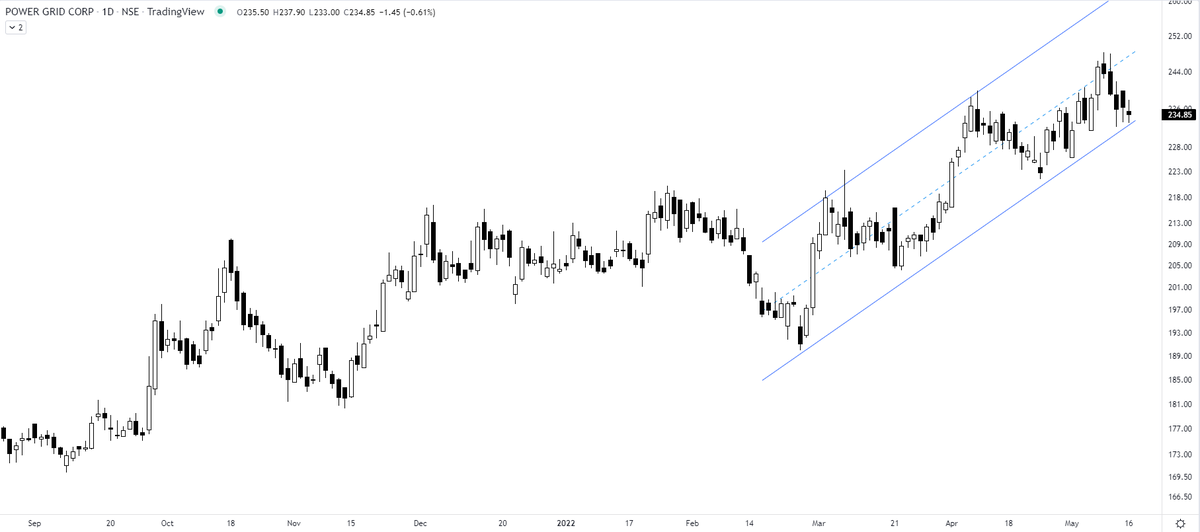
Free advice - get out at the breakout failure
~ price doesn't follow through
~ candles have long upper wicks/close near the lows
~ volume on down days - high
~ price comes back with all of the above within the range
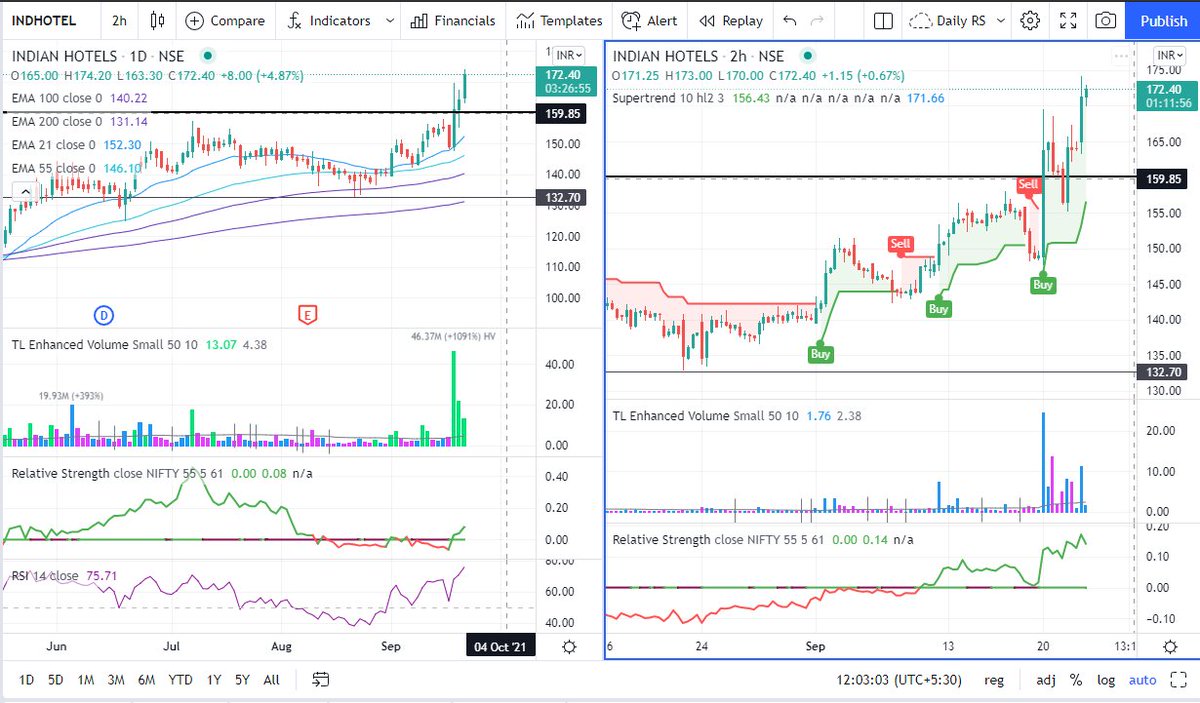
This was a 10,000 candidate by many handles
Bayer Cropscience
More from The_Chartist 📈

More from Screeners


Here I will share what I believe are essentials for anybody who is interested in stock markets and the resources to learn them, its from my experience and by no means exhaustive..
First the very basic : The Dow theory, Everybody must have basic understanding of it and must learn to observe High Highs, Higher Lows, Lower Highs and Lowers lows on charts and their
Even those who are more inclined towards fundamental side can also benefit from Dow theory, as it can hint start & end of Bull/Bear runs thereby indication entry and exits.

Next basic is Wyckoff's Theory. It tells how accumulation and distribution happens with regularity and how the market actually
Dow theory is old but
Old is Gold....
— Professor (@DillikiBiili) January 23, 2020
this Bharti Airtel chart is a true copy of the Wyckoff Pattern propounded in 1931....... pic.twitter.com/tQ1PNebq7d

You May Also Like


These setups I found from the following 4 accounts:
1. @Pathik_Trader
2. @sourabhsiso19
3. @ITRADE191
4. @DillikiBiili
Share for the benefit of everyone.
Here are the setups from @Pathik_Trader Sir first.
1. Open Drive (Intraday Setup explained)
#OpenDrive#intradaySetup
— Pathik (@Pathik_Trader) April 16, 2019
Sharing one high probability trending setup for intraday.
Few conditions needs to be met
1. Opening should be above/below previous day high/low for buy/sell setup.
2. Open=low (for buy)
Open=high (for sell)
(1/n)
Bactesting results of Open Drive
Already explained strategy of #opendrive
— Pathik (@Pathik_Trader) May 27, 2020
Backtested results in 30 stocks and nifty, banknifty.
Success ratio : approx 40-45%
RR average 1:2
Entry as per strategy
Stoploss = Open level
Exit 3:15 PM Or SL
39 months 14 months -ve, 25 +ve
Yearly all 4 years +ve performance. pic.twitter.com/nGqhzMKGVy
2. Two Price Action setups to get good long side trade for intraday.
1. PDC Acts as Support
2. PDH Acts as
So today we will discuss two more price action setups to get good long side trade for intraday.
— Pathik (@Pathik_Trader) June 20, 2020
1. PDC Acts as Support
2. PDH Acts as Support
Example of PDC/PDH Setup given
#nifty
— Pathik (@Pathik_Trader) June 23, 2020
This is how it created long setup by taking support at PDC.
hopefully shared setup on last weekend helped. pic.twitter.com/2mduSUpMn5


