https://t.co/Rbw9wtJNPi
Full technical analysis courses in one thread 🧵
For free which is Worth ₹80k 👇
If you wanna learn how market behave in long term & short term
You must watch full video 🎥 👇
https://t.co/vf8KZSpR7u
https://t.co/oC4cEOnSNu
Trendline is basically use for majoring trend \U0001f4c8 of any stock.
— Vikrant (@Trading0secrets) February 10, 2022
It is also useful for indentify demand & supply ....
Here it's applications \U0001f447
https://t.co/eJ6btIs57Q
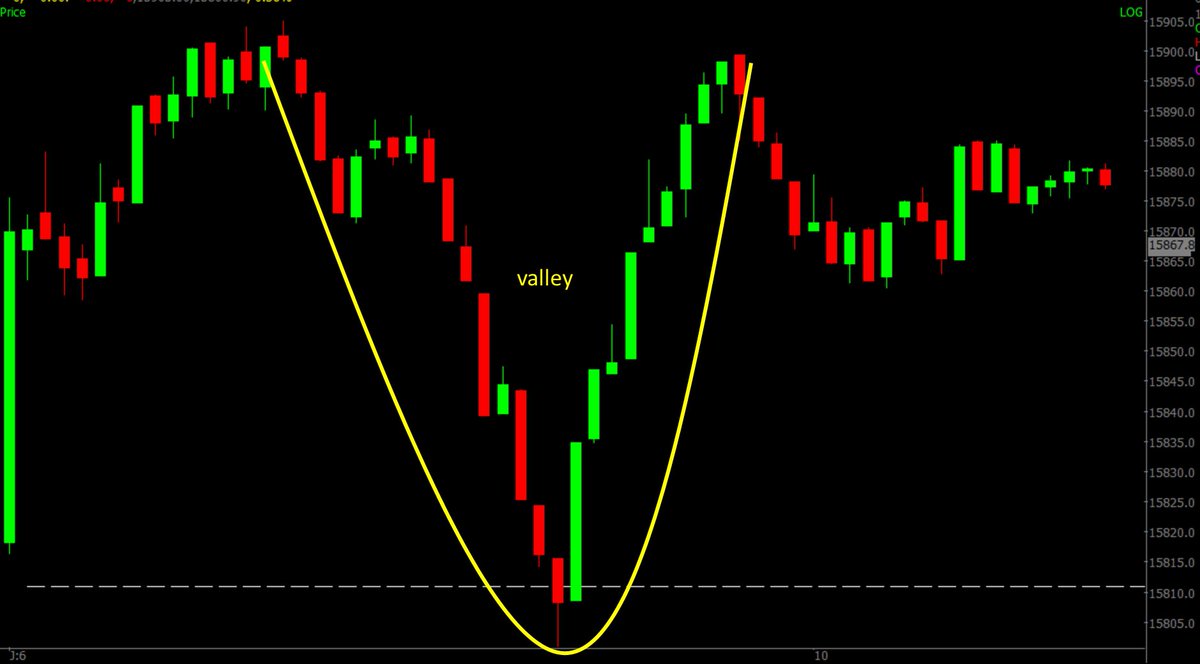
The Trader biggest dilemma is when to book profit
— Vikrant (@Trading0secrets) January 12, 2022
Here is simple solution which I m using from many years.
This not based on any indicators .
( Based on pure price action & days low)
I am swing breakout trader so I will tell you this thread \U0001f9f5 how I book profit \U0001f447
1⃣ potential breakout scanner -
https://t.co/3VJpQHdBxl
2⃣ Short term breakout scanner -
https://t.co/PqFxbAcILk
3️⃣ long term breakout scanner -
https://t.co/OcKDkkyxmP
More from Vikrant
How to find high probability breakouts intraday trades .
Based on my experience , these are the best time to trade breakouts intraday 👇
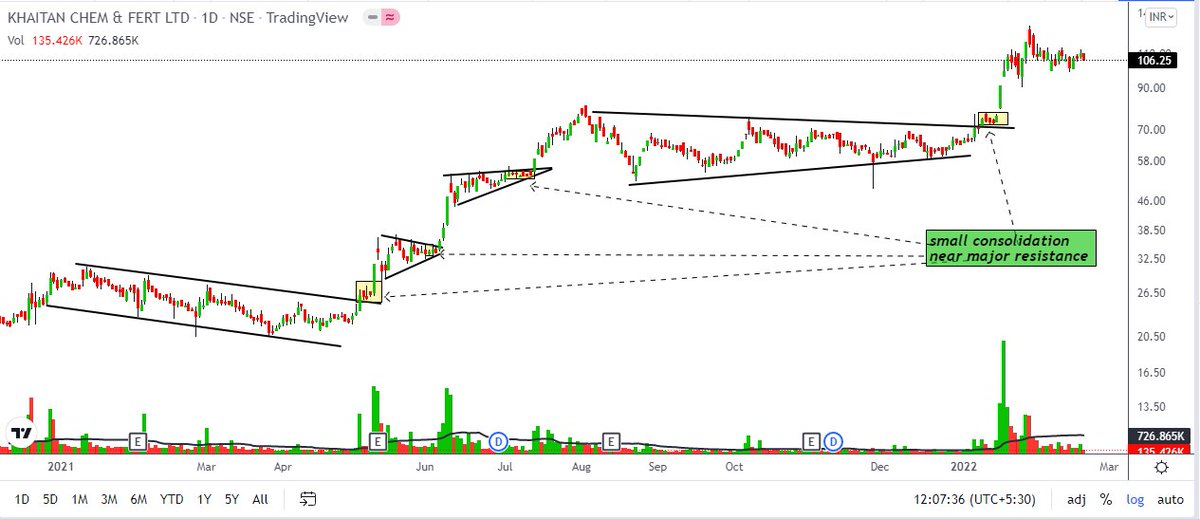
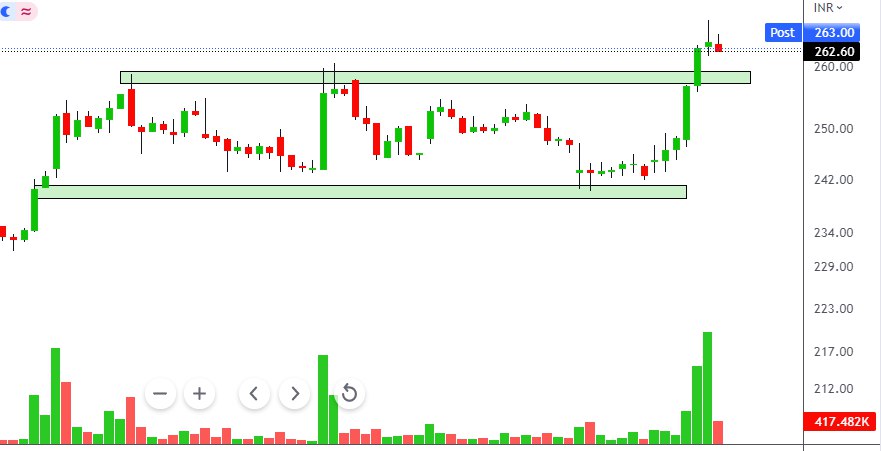
1⃣ When stock is doing small consolidation near major resistance & support
Here risk is very low,
Ex- #khaitanchem https://t.co/uGTZrfQOm4
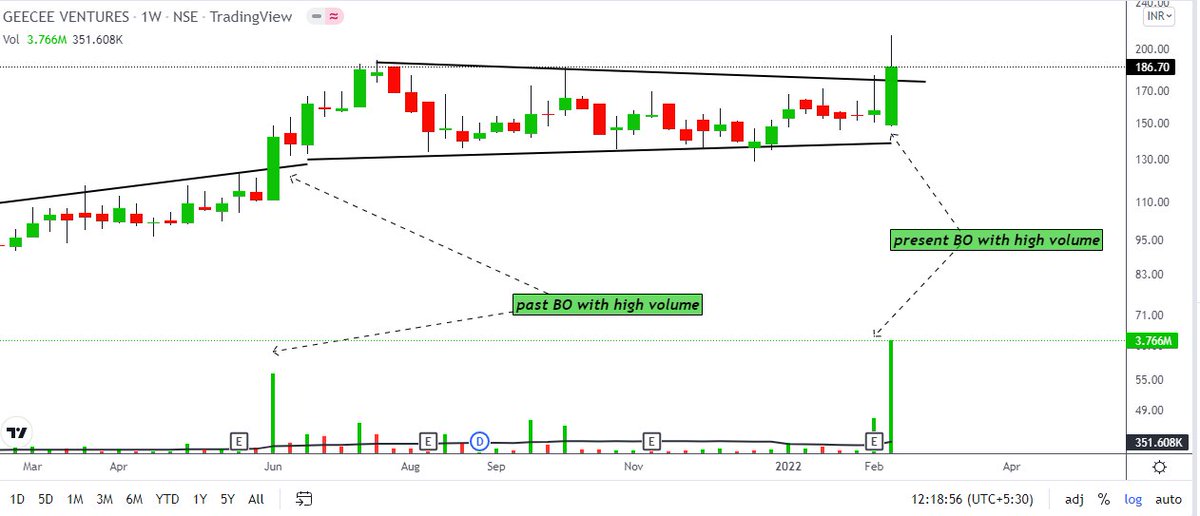
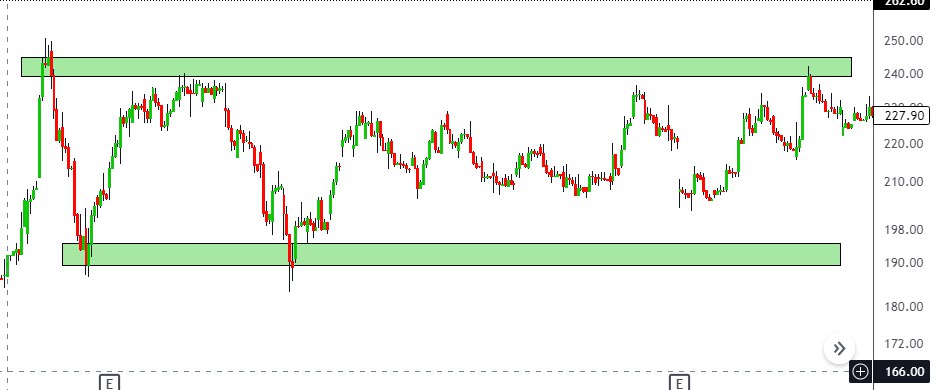
2⃣ When previous BO of stock are very strong with high volume.
#geecee
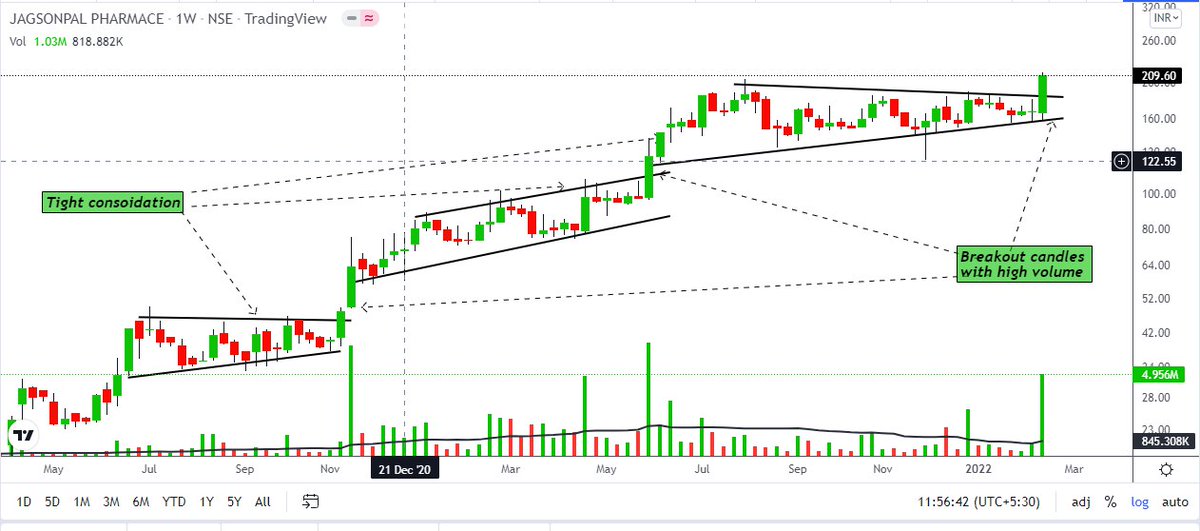
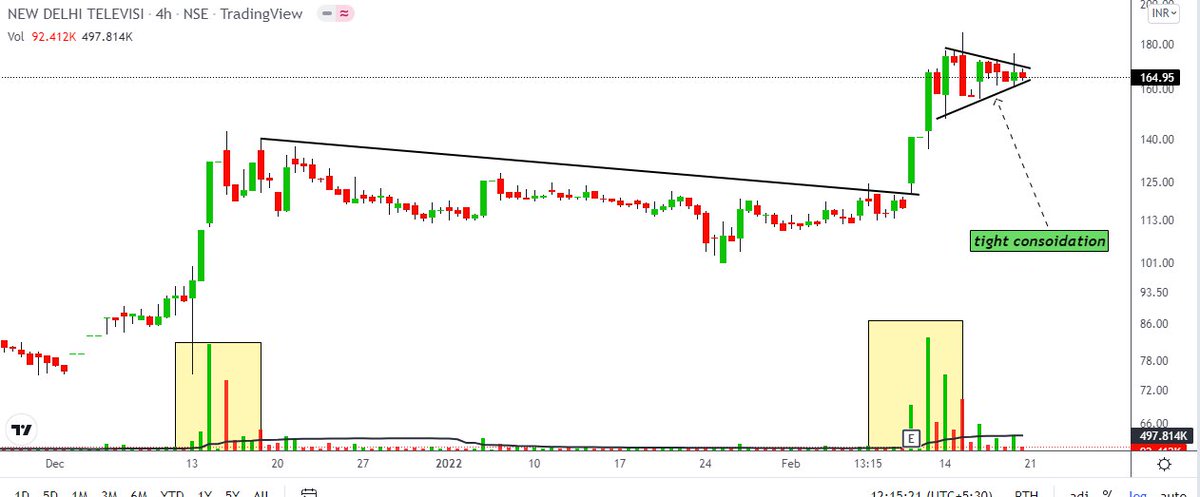
3️⃣ When stock is accumulating in very tight range with low volume & BO with very high volume.
Ex - #jagsonpal
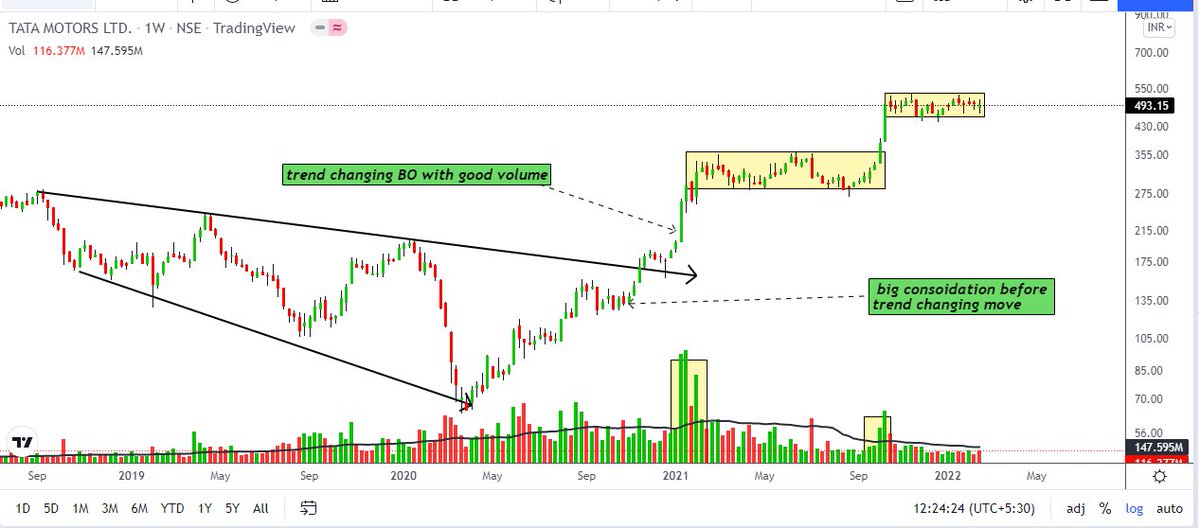
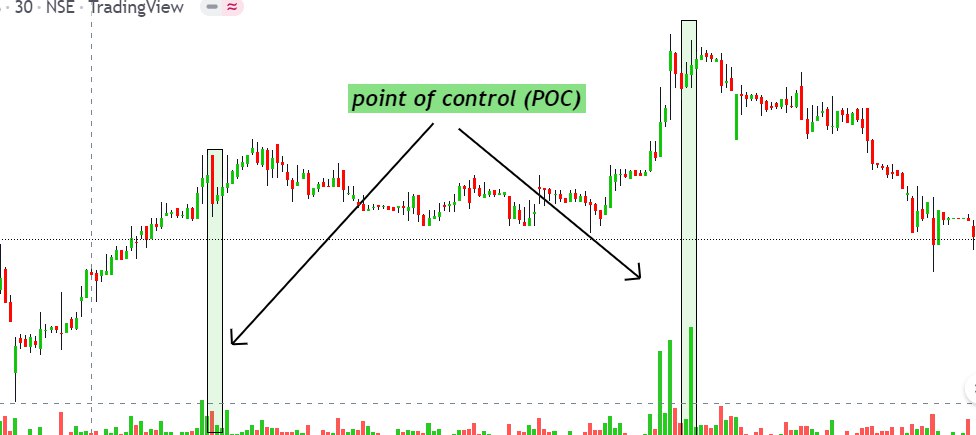
4⃣ When major trend of stock & market must match each other.
And that time their sector must be strong 💪
#tatamotors
5⃣ Recent example of intraday tight range setup for next week which is fullfilling all that criteria 👆👇
Ex - #NDTV
Here risk is 2/3% & reward is 8/15%
Based on my experience , these are the best time to trade breakouts intraday 👇
1⃣ When stock is doing small consolidation near major resistance & support
Here risk is very low,
Ex- #khaitanchem https://t.co/uGTZrfQOm4
In such volatile market I mainly trading intraday with low risk breakout setup .
— Vikrant (@Trading0secrets) February 18, 2022
Making thread \U0001f9f5 on Intraday breakout strategy.
And how I play & when you should avoid intraday.
Try to explain full BO intraday strategy
With examples
Will share thread \U0001f9f5 after completed\U0001f4af
2⃣ When previous BO of stock are very strong with high volume.
#geecee
3️⃣ When stock is accumulating in very tight range with low volume & BO with very high volume.
Ex - #jagsonpal
4⃣ When major trend of stock & market must match each other.
And that time their sector must be strong 💪
#tatamotors
5⃣ Recent example of intraday tight range setup for next week which is fullfilling all that criteria 👆👇
Ex - #NDTV
Here risk is 2/3% & reward is 8/15%


More from Screeners


You May Also Like


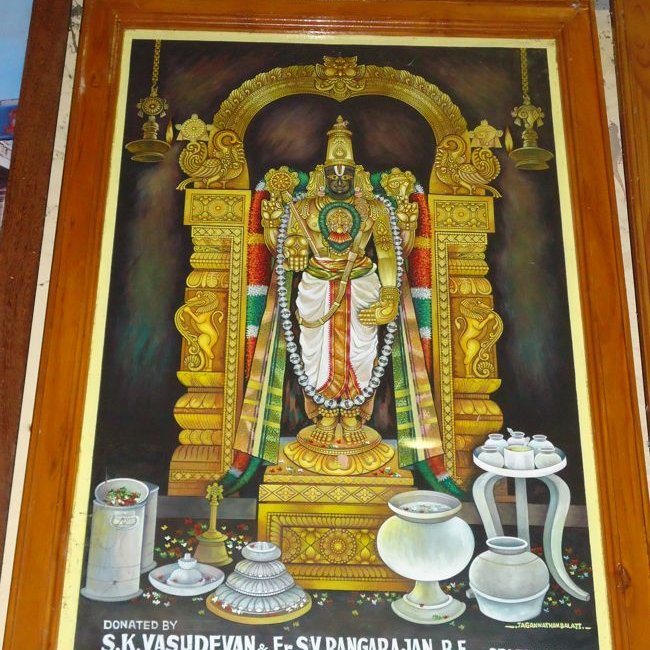

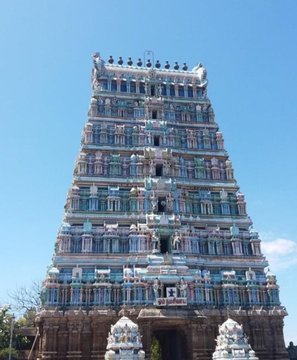
Margatha Natarajar murthi - Uthirakosamangai temple near Ramanathapuram,TN
#ArudraDarisanam
Unique Natarajar made of emerlad is abt 6 feet tall.
It is always covered with sandal paste.Only on Thriuvadhirai Star in month Margazhi-Nataraja can be worshipped without sandal paste.
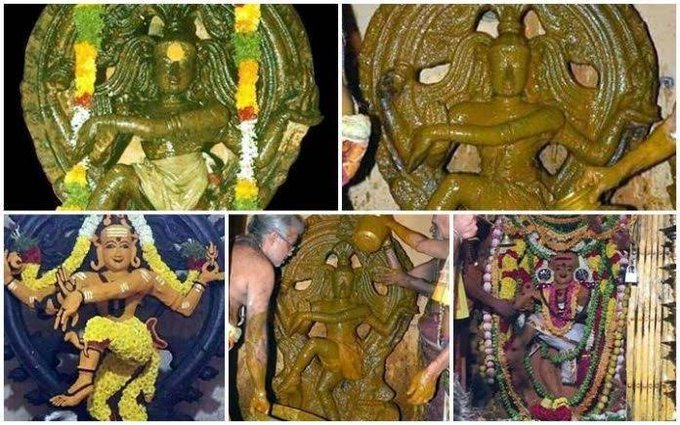
After removing the sandal paste,day long rituals & various abhishekam will be https://t.co/e1Ye8DrNWb day Maragatha Nataraja sannandhi will be closed after anointing the murthi with fresh sandal paste.Maragatha Natarajar is covered with sandal paste throughout the year
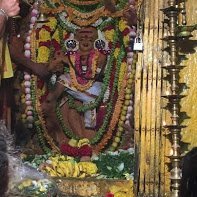
as Emerald has scientific property of its molecules getting disturbed when exposed to light/water/sound.This is an ancient Shiva temple considered to be 3000 years old -believed to be where Bhagwan Shiva gave Veda gyaana to Parvati Devi.This temple has some stunning sculptures.
#ArudraDarisanam
Unique Natarajar made of emerlad is abt 6 feet tall.
It is always covered with sandal paste.Only on Thriuvadhirai Star in month Margazhi-Nataraja can be worshipped without sandal paste.
After removing the sandal paste,day long rituals & various abhishekam will be https://t.co/e1Ye8DrNWb day Maragatha Nataraja sannandhi will be closed after anointing the murthi with fresh sandal paste.Maragatha Natarajar is covered with sandal paste throughout the year
as Emerald has scientific property of its molecules getting disturbed when exposed to light/water/sound.This is an ancient Shiva temple considered to be 3000 years old -believed to be where Bhagwan Shiva gave Veda gyaana to Parvati Devi.This temple has some stunning sculptures.