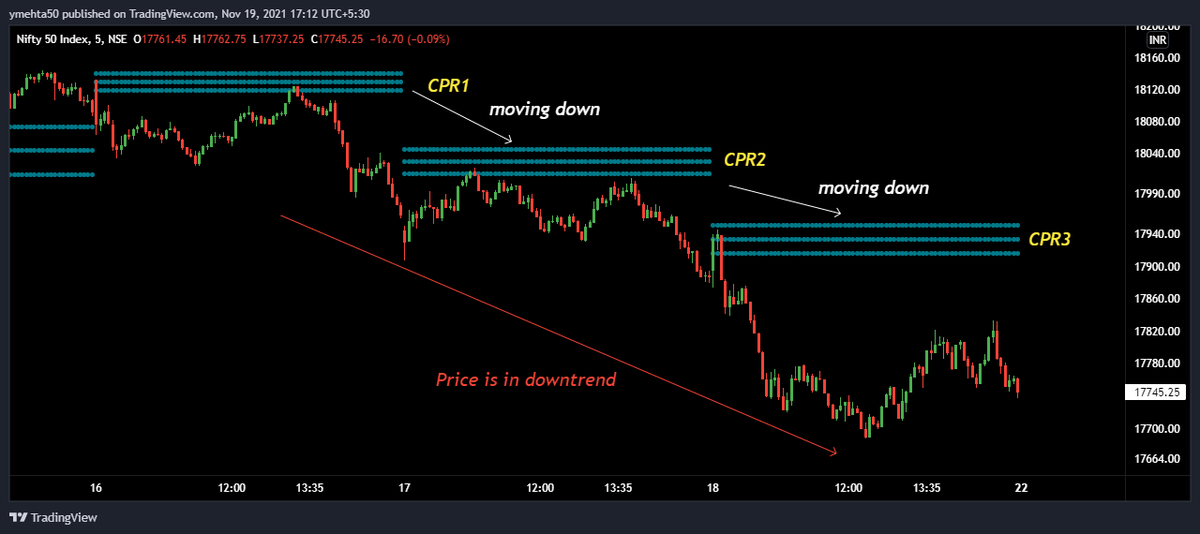
CPR is just the three lines which is like a magnet and price approaches these levels. CPR acts like a support or resistance.
2/24


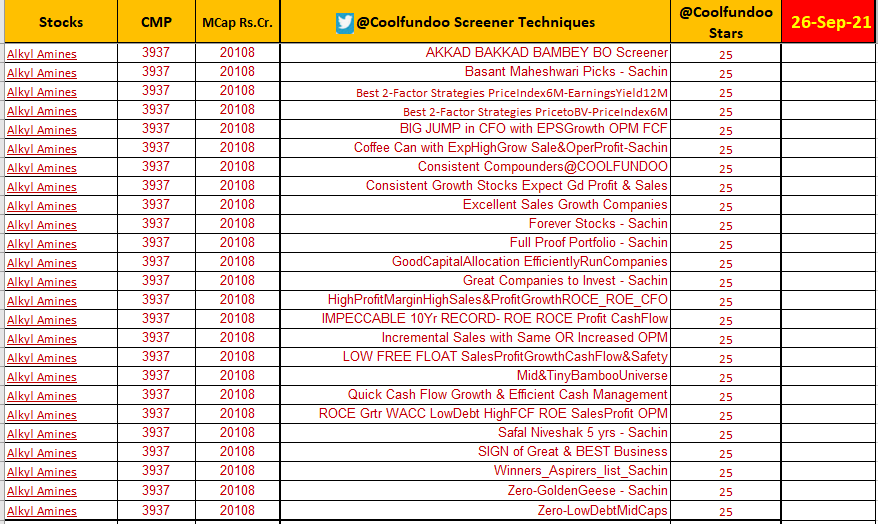
Stock Screeners is an integral part of doing homework post market hours.
— Yash Mehta (@YMehta_) August 5, 2022
Most of us use screeners to filter buzzing stocks out of 1000+ stock and it saves lot of times.
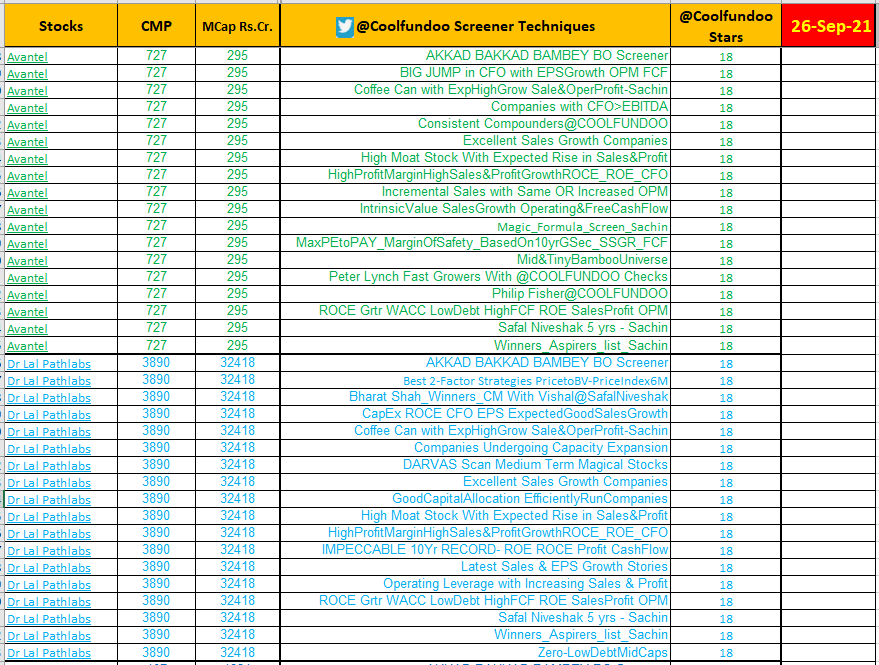
Here is the list of top screeners:
Also, last screener is one of my favourite to pick early momentum stocks.
Screeners helps trader in saving lot of time in filtering best stocks out of 1000+ stocks listed.
— Yash Mehta (@YMehta_) September 16, 2022
Here is the list of top 9 Free Price Action based screeners that I use:
Also, last screener is my favorite to pick early momentum stocks.
Screeners helps trader in saving lot of time in filtering best stocks out of 5000+ listed stocks.
— Yash Mehta (@YMehta_) October 7, 2022
Here is the list of top 7 Free Strategy and its respective screeners that I use:
Also, last screener is my favorite to pick early momentum stocks.
There are various Options Greeks like: Delta, Gamma, Vega, Rho, Theta.
— Yash Mehta (@YMehta_) September 4, 2022
A complete guide on how these #Option Greeks impact option price.
Option trading is tough but here\u2019s what can make it easier for you
— The Chartians (@chartians) September 17, 2022
8 option strategies that you can use in any market (sold as a \u20b9 50,000 course !)
They say options trading can make YOU BANKRUPT - is it true ?
— The Chartians (@chartians) September 23, 2022
If yes then why ?
A thread on Risk management and Position sizing in options trading (worth 50k\u20b9 course)\U0001f9f5
101 guide on how you can start option selling to generate active returns with less capital (Rs 1 Lakh) \U0001f9f5:
— Yash Mehta (@YMehta_) August 19, 2022
A course on option selling available for free.
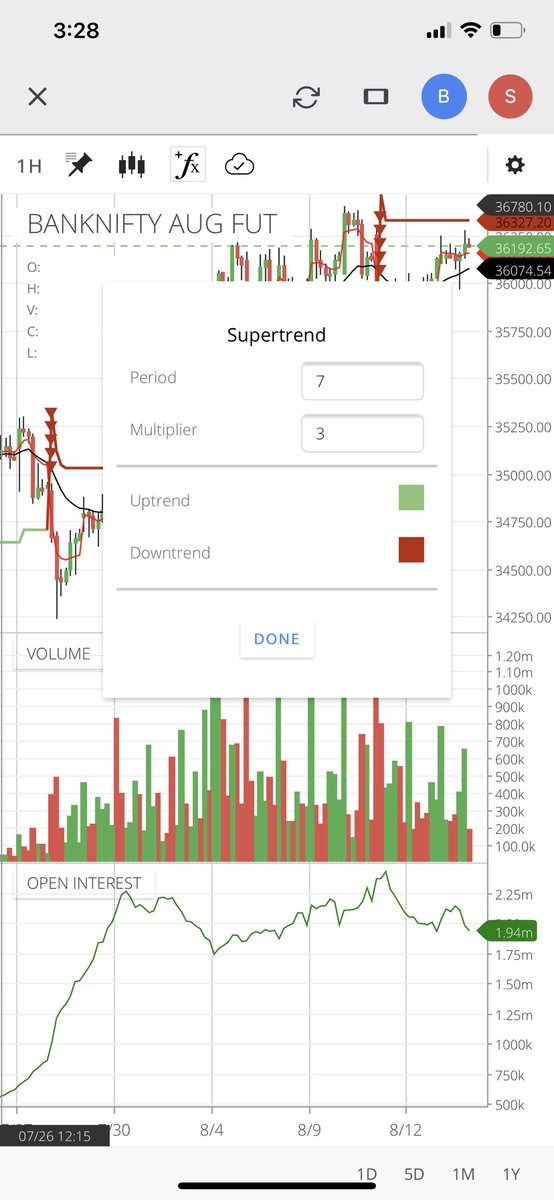
Moving Averages is a common indicator which most of us (novice/professional) use in the stock market for trading and investment.
— Yash Mehta (@YMehta_) October 11, 2021
This learning thread would be on
"\U0001d650\U0001d668\U0001d65a\U0001d668 \U0001d664\U0001d65b \U0001d648\U0001d664\U0001d66b\U0001d65e\U0001d663\U0001d65c \U0001d63c\U0001d66b\U0001d65a\U0001d667\U0001d656\U0001d65c\U0001d65a"
Like\U0001f44d & Retweet\U0001f504 for wider reach and more such learning thread.
1/10
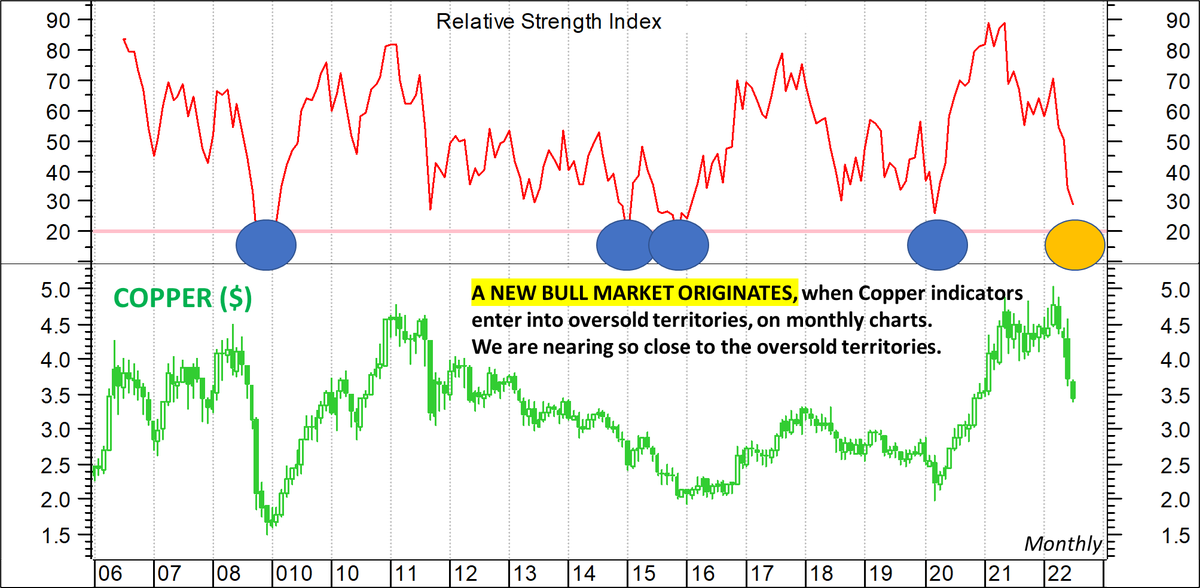
#RSI is a common indicator which most of us use in the stock market.
— Yash Mehta (@YMehta_) October 22, 2021
This learning thread would be on
"\U0001d650\U0001d668\U0001d65a\U0001d668 \U0001d664\U0001d65b \U0001d64d\U0001d64e\U0001d644"
Like\U0001f44d & Retweet\U0001f504 for wider reach and for more such learning thread in the future.
Also, an investment strategy is shared using RSI in the end.
1/16
#CCI is an indicator which is used in the #stockmarket
— Yash Mehta (@YMehta_) February 26, 2022
This learning thread would be on
"\U0001d650\U0001d668\U0001d65a\U0001d668 \U0001d664\U0001d65b \U0001d63e\U0001d63e\U0001d644"
Also, an investment strategy and trading strategy is shared
If you appreciate this, a Like & Retweet will go a long way in maximizing the reach of this tweet\u2665\ufe0f
1/19
#CPR is an indicator which is used for #Intraday in Stock Market.
— Yash Mehta (@YMehta_) November 19, 2021
This learning thread would be on
"\U0001d650\U0001d668\U0001d65a\U0001d668 \U0001d664\U0001d65b \U0001d63e\U0001d64b\U0001d64d"
Like\u2764\ufe0f& Retweet\U0001f501for wider reach and for more such learning thread in the future.
Also, an investment strategy is shared using CPR in the end.
1/24