This is Nature's Law; Crowd behaviour and we deal with just that.


Book mark this and revisit every day or every week till you get it right as a trader. Coming from an experienced trader like @MaverickAmit01 , it's priceless.
— Van Ilango (JustNifty) (@JustNifty) July 31, 2021
Wish we had it when we started out.\U0001f64f https://t.co/0NYKqedy9w
#auropharma "Hour t/f" for "Traders"
— Van Ilango (JustNifty) (@JustNifty) March 21, 2022
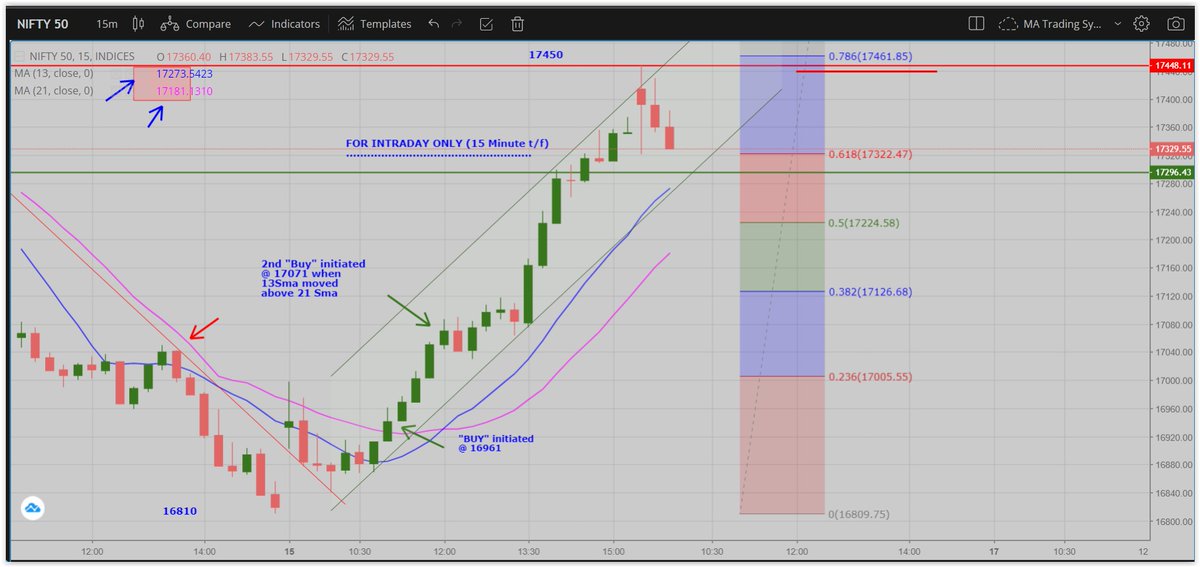
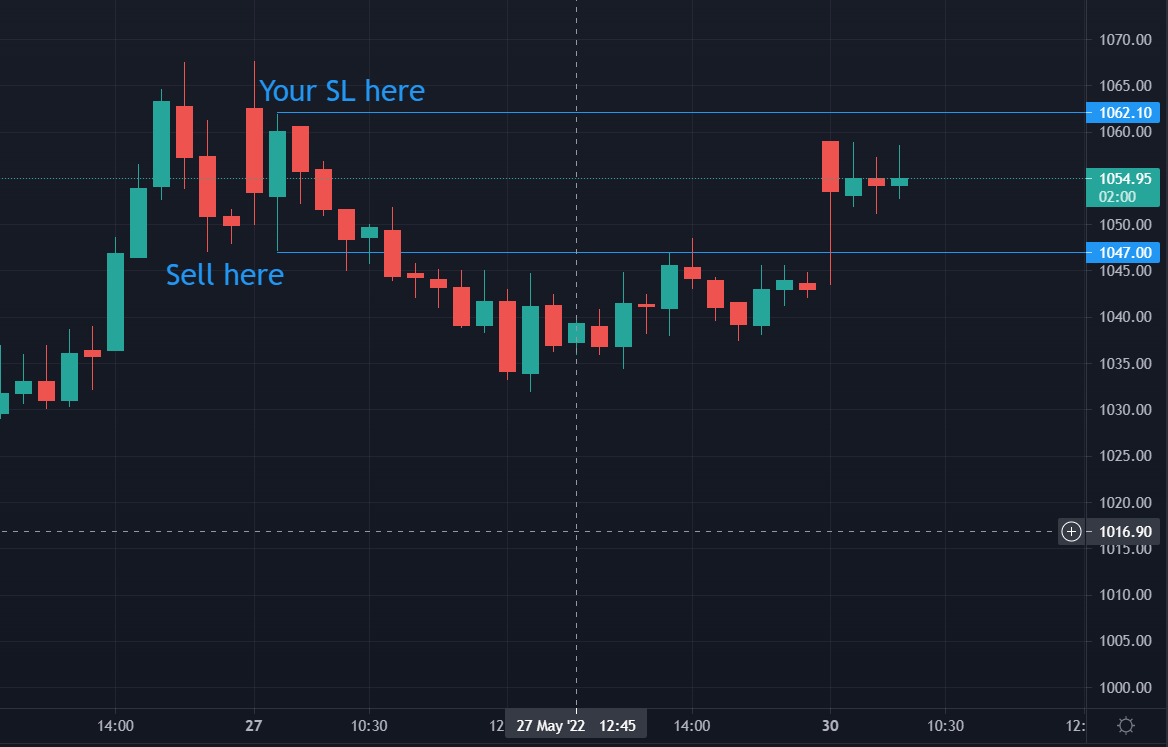
In search of the highly rewarding 2nd wave entry.
Today's & tomorrow's #priceaction would have more clarity for entry either @ 615-620 or above 655 https://t.co/20S0Lvc7ej pic.twitter.com/OFlf9MLkqz
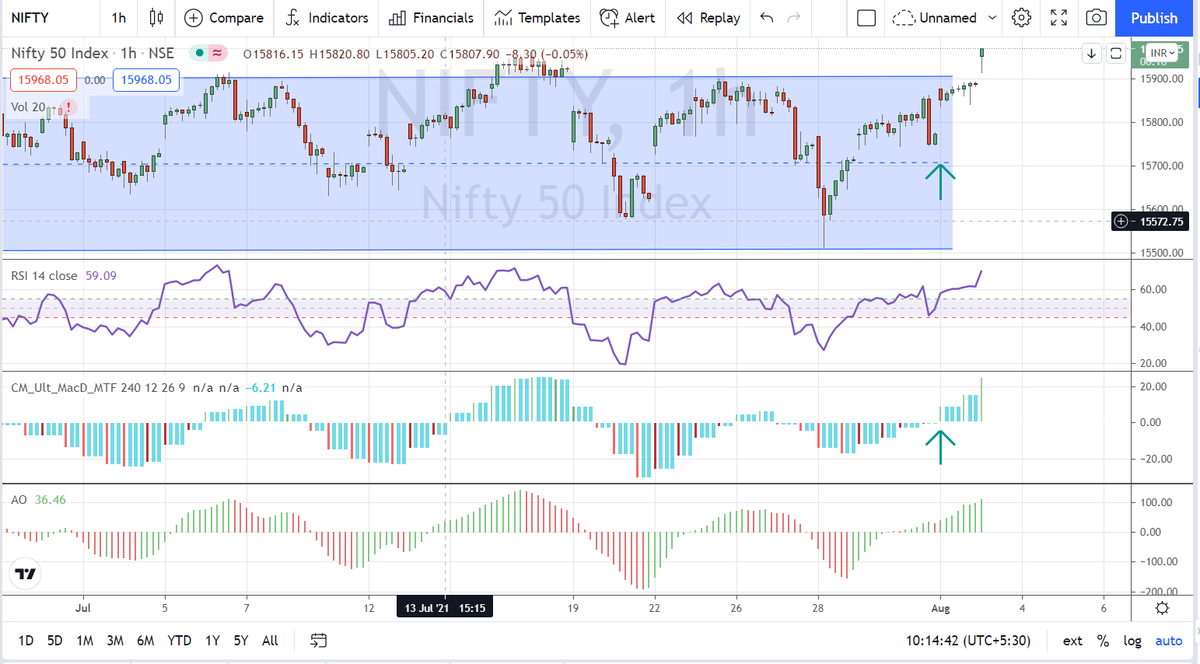
This is the daily update and attached is the trade sheet from 1st Dec till date. Total profit is 3922 Points per Nifty lot by simply following price. https://t.co/8ZCC0nSWuW
— Harsh (@_Harsh_Mehta_) February 17, 2022
#CPR is an indicator which is used for #Intraday in Stock Market.
— Yash Mehta (@YMehta_) November 19, 2021
This learning thread would be on
"\U0001d650\U0001d668\U0001d65a\U0001d668 \U0001d664\U0001d65b \U0001d63e\U0001d64b\U0001d64d"
Like\u2764\ufe0f& Retweet\U0001f501for wider reach and for more such learning thread in the future.
Also, an investment strategy is shared using CPR in the end.
1/24
CPR indicator trend analysis:
— Gomathi Shankar (@cprbykgs) January 25, 2022
Candles below daily & weekly CPR \U0001f43b
Candles above daily CPR but below weekly CPR early confirmation of \U0001f402
Candles above daily + weekly CPR strong confirmation of \U0001f402
Isn\u2019t it simple?#cprbykgs #cprindicator #nifty #banknifty
#banknifty
— Gomathi Shankar (@cprbykgs) July 9, 2021
Candles above monthly CPR- Bullish
Candles above weekly CPR- Bullish
Now, whenever candles enter daily CPR range it indicates weakness of current trend & early signs of trend reversal.
So, wait for the candles to exit the daily CPR range then take the trade. (1/4) pic.twitter.com/7vaaLMCrV8