For finding potential breakout candidates, you may run this scanner daily EOD, whenever any new candidate props up, check its chart for signs of breakout.
You may modify & fine tune this as per your own criteria like adding RSI or ADX or other indicators. https://t.co/FdiPG1c4s0
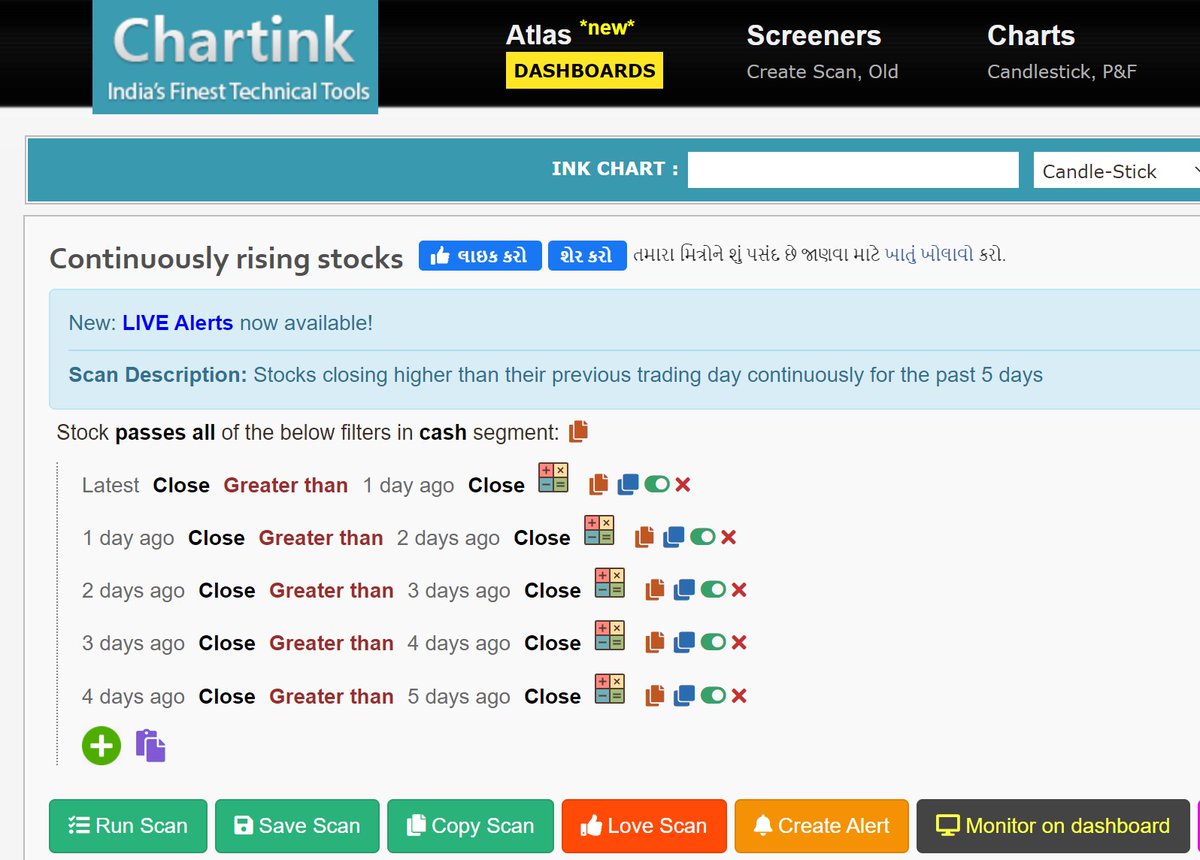
Bhai, can you please educate us, how do you find the breakout stocks? I mean which scanner? Any inputs would be much helpful.
— Loyalty Respect (@Novicetrader99) October 1, 2021
More from Professor
1. Darvas Box System
2. ATR based trailing
3. PSAR based trailing
4. EMA Crossover based trailing
Okay sir but dusre konse method se exit ya profit book kar sakte hai sir sry apako bohot pareshan kar raha hu but sry sir
— learner \u2600\ufe0f\u2600\ufe0f (@darvaxfan1845) March 12, 2022
One of the best way that I know is ATR based trailing.
Here is an example https://t.co/BTATx5fyW6
An example of ATR based TSL.
— Professor (@DillikiBiili) April 9, 2021
SL for coming candle is Low of the just completed candle - ATR of previous candle. Chart is self explanatory. https://t.co/D95iv4t5j6 pic.twitter.com/e8BkO2j5rn

As per Normal Distribution 68% of the time movement is with 1% SD Limits.
For 95% pf the times movement is within 2% SD limits.
And its only 0.3% of the times that movement exceeds 3 SD.
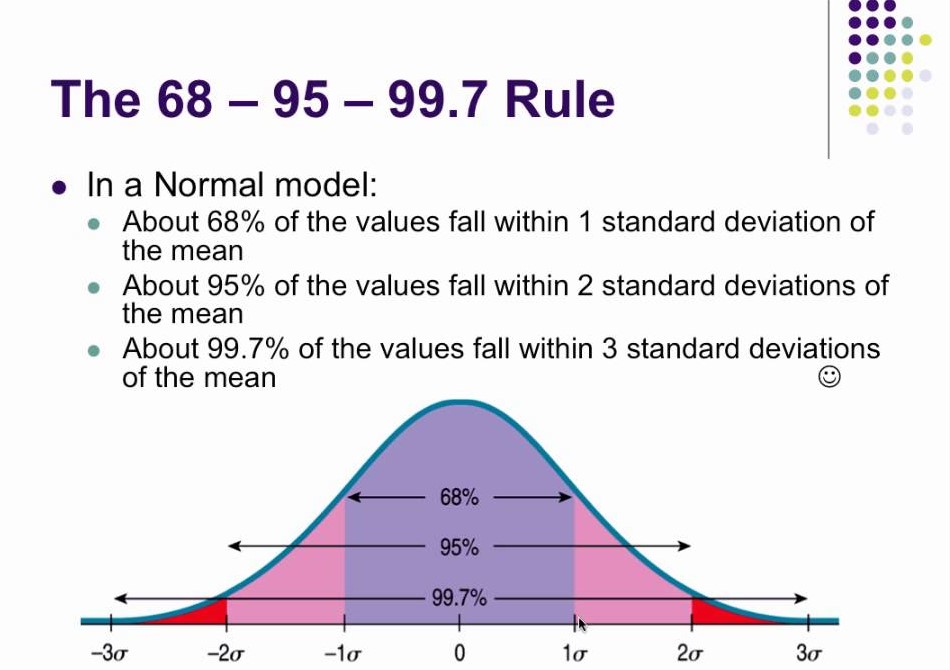
Since 95% covers a lot of ground that's why 2SD is considered to be a a safe range for most events.
The farther we move from the average, chances of occurrence go down. This is what Taleb sahab calls Tail risk, because it lies in the tail of the standard distribution curve.
Normal distribution occurs everywhere. See this
The Galton Machine shows order from randomness. Each ball bounces left or right at random, 12 times, but together where they fall can be predicted - the normal distribution. This one made by: https://t.co/oI9wOGq7nG pic.twitter.com/VQtVu66OSE
— Tom Stafford (@tomstafford) April 19, 2018
Bollinger Band, which is a very popular indicator has a setting of 2SD. Because its expected that 95% of the time moves will be confined to 2SD limits.
When we say that price is at upper/lower Bollinger band, we are saying that it has reached 2 SD limits and likely to reverse.
Now coming to current scenario, open Nifty daily chart and apply two bollinger Bands on it.
First with default setting and in second change settings to 3 standard deviation.
Crossing 3 SD boundary means that Nifty is now in very rare territory where it has been only 0.3%
More from Screeners


You May Also Like


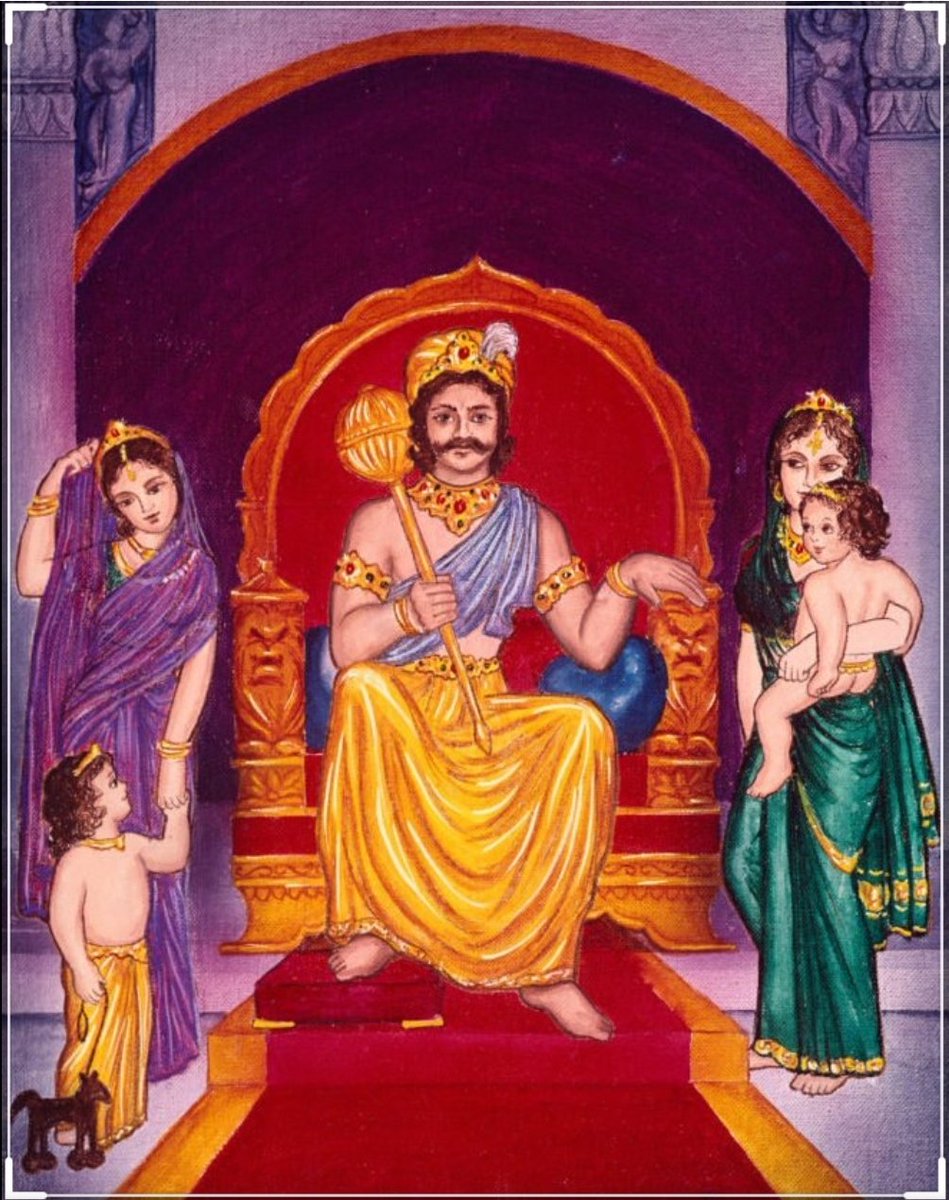
Once upon a time there was a Raja named Uttānapāda born of Svayambhuva Manu,1st man on earth.He had 2 beautiful wives - Suniti & Suruchi & two sons were born of them Dhruva & Uttama respectively.
#talesofkrishna https://t.co/E85MTPkF9W
Prabhu says i reside in the heart of my bhakt.
— Right Singh (@rightwingchora) December 21, 2020
Guess the event. pic.twitter.com/yFUmbfe5KL
Now Suniti was the daughter of a tribal chief while Suruchi was the daughter of a rich king. Hence Suruchi was always favored the most by Raja while Suniti was ignored. But while Suniti was gentle & kind hearted by nature Suruchi was venomous inside.
#KrishnaLeela

The story is of a time when ideally the eldest son of the king becomes the heir to the throne. Hence the sinhasan of the Raja belonged to Dhruva.This is why Suruchi who was the 2nd wife nourished poison in her heart for Dhruva as she knew her son will never get the throne.
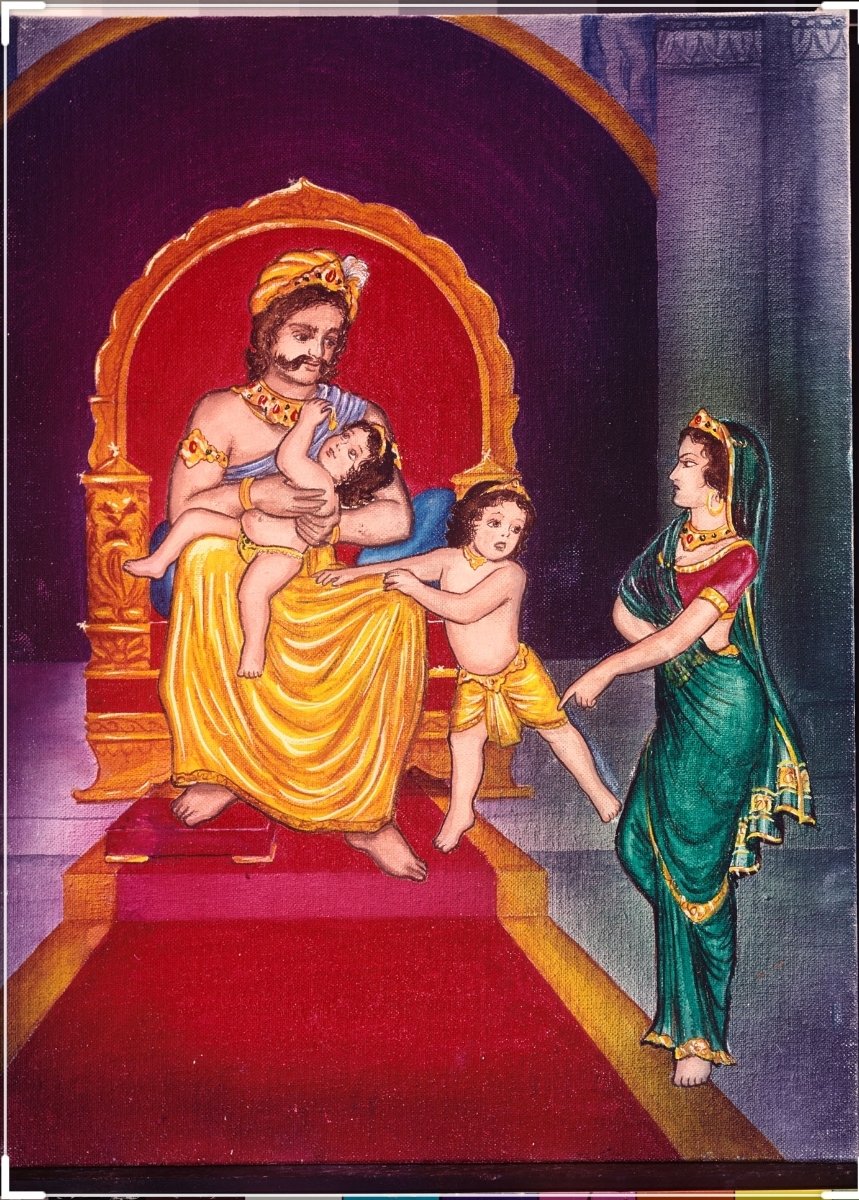
One day when Dhruva was just 5 years old he went on to sit on his father's lap. Suruchi, the jealous queen, got enraged and shoved him away from Raja as she never wanted Raja to shower Dhruva with his fatherly affection.
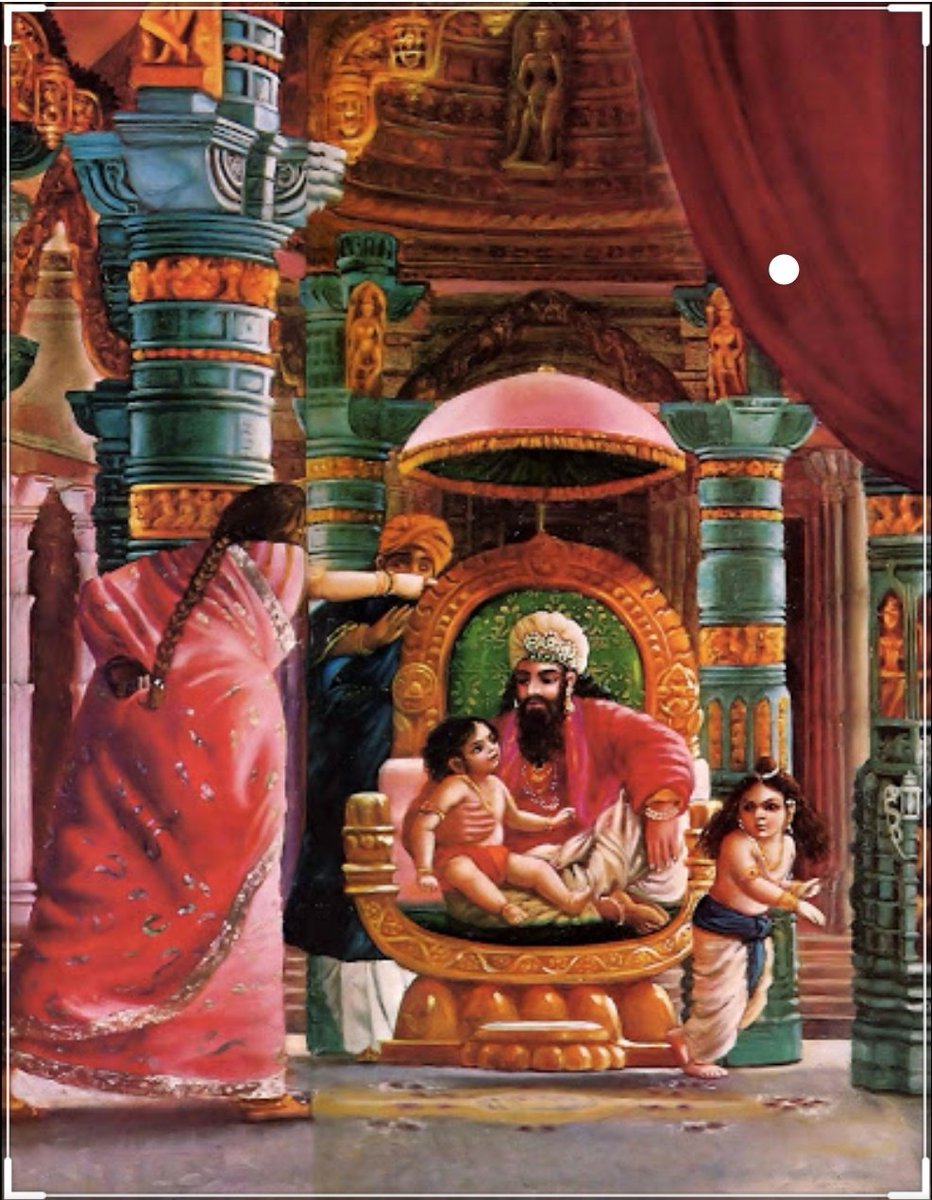
Dhruva protested questioning his step mother "why can't i sit on my own father's lap?" A furious Suruchi berated him saying "only God can allow him that privilege. Go ask him"