CreditAccess update https://t.co/QqfzUFATcb
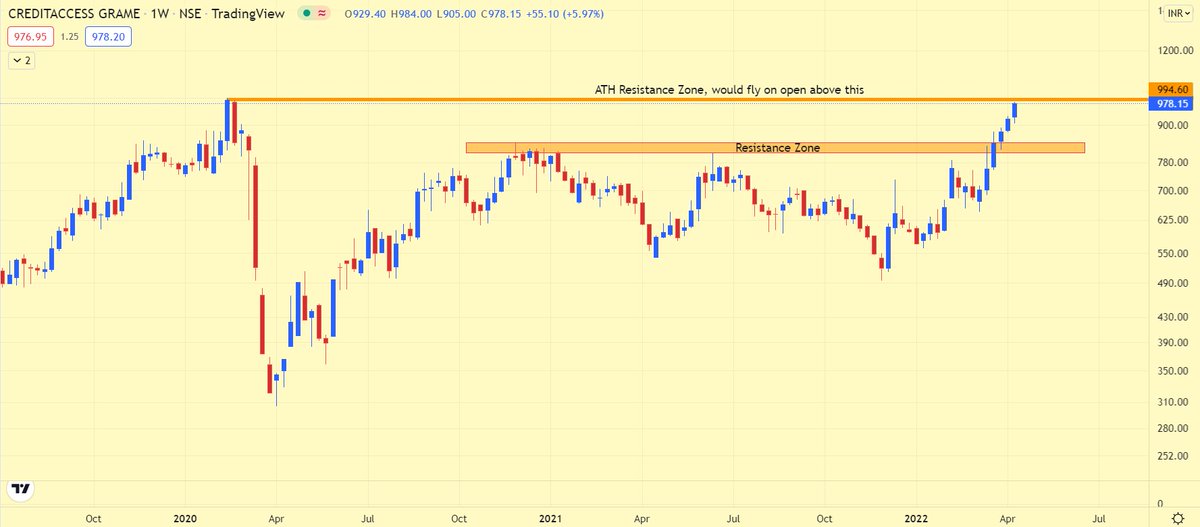
CreditAccess update https://t.co/rCTPK5RQtl pic.twitter.com/Qc35AUCSrO
— Professor (@DillikiBiili) March 25, 2022
More from Professor

Starting the Beginner’s Pathway thread for Fundamental Investing.
One Chadarmod on timeline posted that I’m giving gyan without having experience or expertise.
So I’ll begin with paying my portfolio performance tribute to these charlies.
https://t.co/GNM5SsNFNo
Fundamentals based investing can generate serious wealth as the most famous (rather infamous) Warren Buffett has shown.
In India also we have many success stories like @VijayKedia1 @Raamdeo R K Damani Rakesh Jhunjhunwala Late Chandrakant Sampat and many many more....
Though I can't stop mentioning that both Rakesh Jhunjhunwala and R K Damani were traders in their initial days.
Rakesh Jhunjhunwala still trades, he once said Traing is fun, its le fatafat, de fatafat
A lot of people (specially the beginners) buy stocks based on some friend's recommendation : XYZ le le, pukka chalega, maine bhi le rakha hai.
Few might have made money this way, but most do not. Why ?
There has to be a process.
Fundamentals based investing need thorough analysis of the Business & Company.
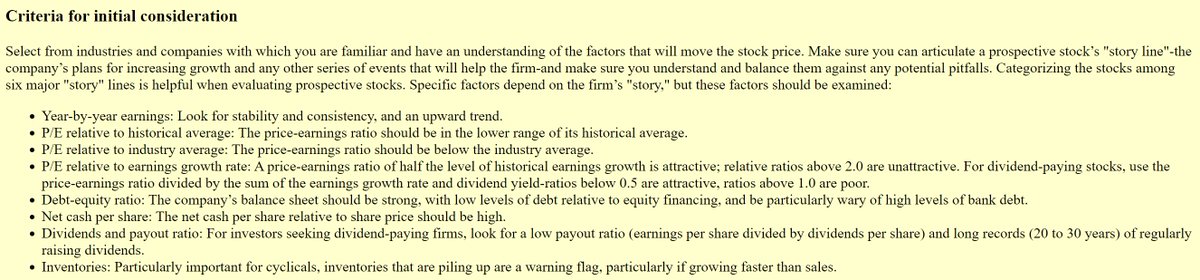
Here is a preliminary checklist by the legendary investor Peter lynch
One Chadarmod on timeline posted that I’m giving gyan without having experience or expertise.
So I’ll begin with paying my portfolio performance tribute to these charlies.
https://t.co/GNM5SsNFNo
Sadda Haqq ! Aithe Rakhh......... pic.twitter.com/IH5q3v2gw9
— Professor (@DillikiBiili) October 5, 2021
Fundamentals based investing can generate serious wealth as the most famous (rather infamous) Warren Buffett has shown.
In India also we have many success stories like @VijayKedia1 @Raamdeo R K Damani Rakesh Jhunjhunwala Late Chandrakant Sampat and many many more....
Though I can't stop mentioning that both Rakesh Jhunjhunwala and R K Damani were traders in their initial days.
Rakesh Jhunjhunwala still trades, he once said Traing is fun, its le fatafat, de fatafat
A lot of people (specially the beginners) buy stocks based on some friend's recommendation : XYZ le le, pukka chalega, maine bhi le rakha hai.
Few might have made money this way, but most do not. Why ?
There has to be a process.
Fundamentals based investing need thorough analysis of the Business & Company.
Here is a preliminary checklist by the legendary investor Peter lynch
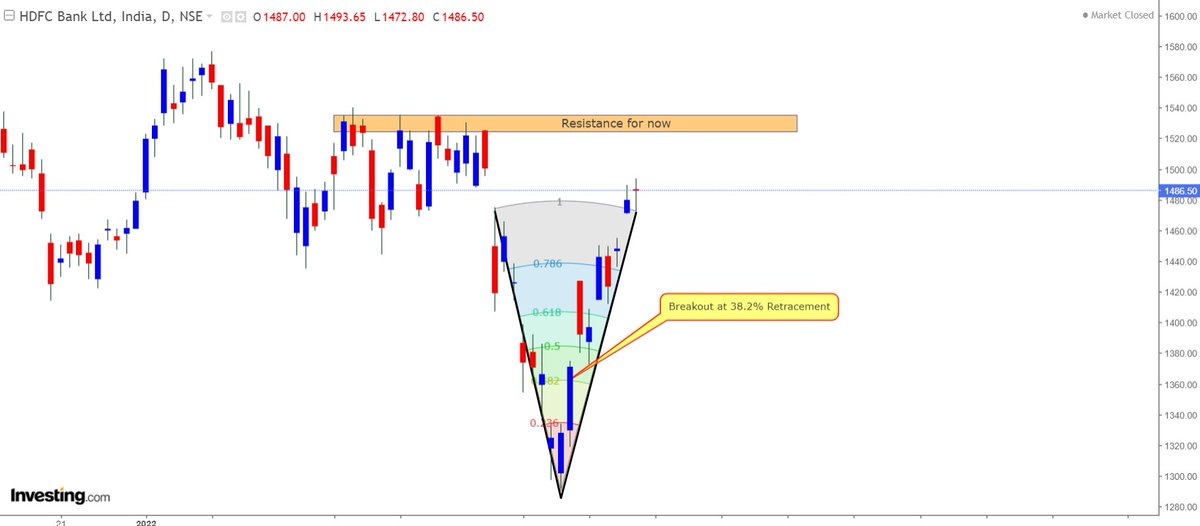
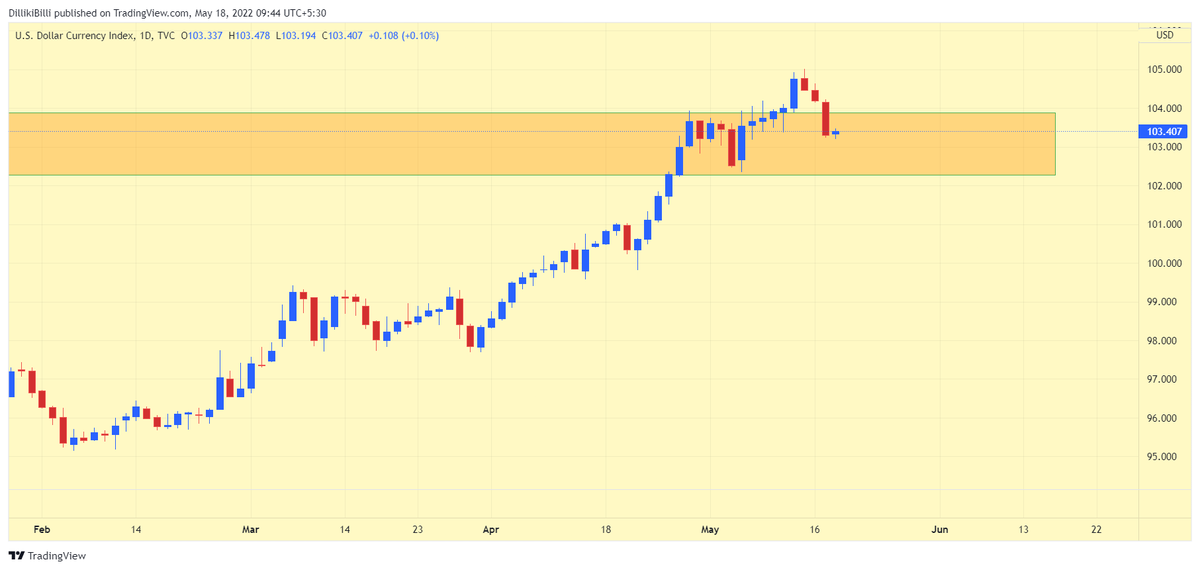
Jab tak ki meri book nahi aati, ye kar lo:
1. Go through Zerodha Varsity chapters on Technical Analysis at least 2 times.
2. Then read 'Technical Analysis Explained' by Martin Pring
3. Finally read 'Price Action bar by bar' by Al Books (Not for casual reader).
1. Go through Zerodha Varsity chapters on Technical Analysis at least 2 times.
2. Then read 'Technical Analysis Explained' by Martin Pring
3. Finally read 'Price Action bar by bar' by Al Books (Not for casual reader).
Sir @DillikiBiili , could you please suggest a book for technical analysis ?
— Pawan Yadav (@pawan_yadav86) March 25, 2022