
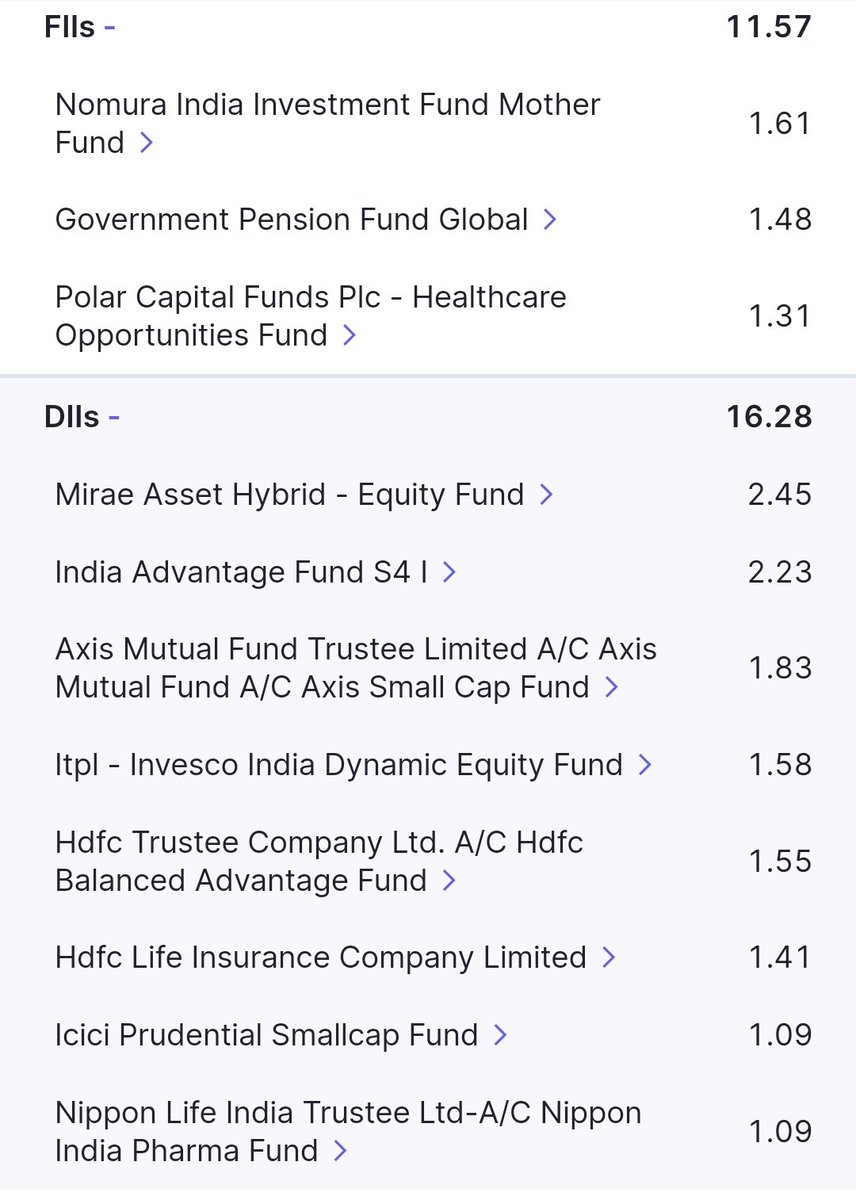
What a good shareholding pattern👌
Look at the kind of FIIs and DIIs holding the comp
Dream names🙂
More from Shreenidhi P
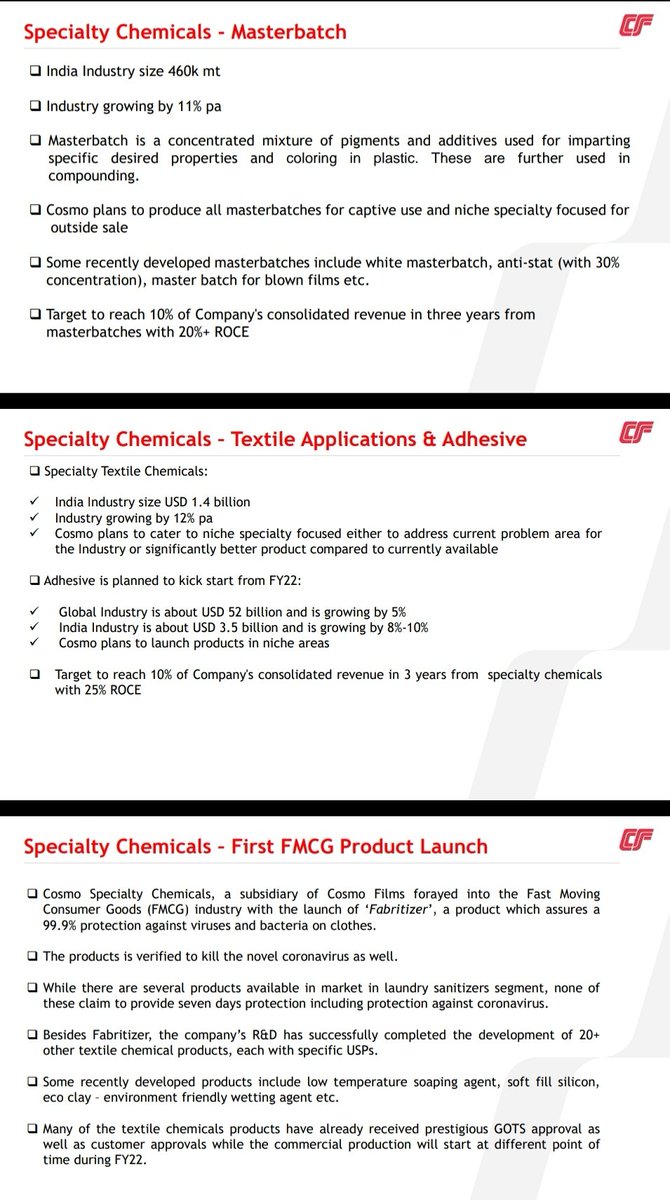
Cosmo films
Investor ppt
Splty side:3yr target
Masterbatches-10% rev,20% RoCE
Textile chem-10% rev,25% RoCE
FMCG-Fabricizer launched
30% RoE,22% RoCE-fy21
1% shift in splty adds 5cr EBITDA
Target-62% to 80%
Net d/e 0.5x
D/EBITDA 1x
Petcare-plans 2 demerge in2 seperate entity https://t.co/Iq4VT6tG50
Investor ppt
Splty side:3yr target
Masterbatches-10% rev,20% RoCE
Textile chem-10% rev,25% RoCE
FMCG-Fabricizer launched
30% RoE,22% RoCE-fy21
1% shift in splty adds 5cr EBITDA
Target-62% to 80%
Net d/e 0.5x
D/EBITDA 1x
Petcare-plans 2 demerge in2 seperate entity https://t.co/Iq4VT6tG50
Cosmo films#cosmofilms
— Shreenidhi P (@nid_rockz) August 4, 2021
Probably the best results of the day
Glimpse of last 5qtr
Rev,EBITDA,pbt n PAT growth every qtr
Highest OPM 19%
Q1 EBITDA 132cr n PBT 116cr
Last 5yrs
OPM 7% to 17%\U0001f44c
80% pf-speciality-fy23
Superb debt management
Liberal dividend n buyback
Solid OCF\U0001f44c pic.twitter.com/6ulhmHZf24
First interview of Hiral Chandrana
#MASTEK
Adding 40+ customers every quarter from an year
650+ active clients
Met 150+ customers/partners virtually in last 40days
Focus to accelerate US growth-have strategy in place
960cr cash on books
Looking for organic+inorganic growth
#MASTEK
Adding 40+ customers every quarter from an year
650+ active clients
Met 150+ customers/partners virtually in last 40days
Focus to accelerate US growth-have strategy in place
960cr cash on books
Looking for organic+inorganic growth
#CNBCTV18Exclusive | Catch @_anujsinghal, @_soniashenoy & @SurabhiUpadhyay in conversation with @HiralChandrana who was appointed as global CEO of #Mastek last month. He says that a big part of their strategy is to grow in the US. @Reematendulkar pic.twitter.com/nRnfGoGHTp
— CNBC-TV18 (@CNBCTV18News) August 18, 2021
More from Screeners


You May Also Like

https://t.co/6cRR2B3jBE
Viruses and other pathogens are often studied as stand-alone entities, despite that, in nature, they mostly live in multispecies associations called biofilms—both externally and within the host.
https://t.co/FBfXhUrH5d

Microorganisms in biofilms are enclosed by an extracellular matrix that confers protection and improves survival. Previous studies have shown that viruses can secondarily colonize preexisting biofilms, and viral biofilms have also been described.

...we raise the perspective that CoVs can persistently infect bats due to their association with biofilm structures. This phenomenon potentially provides an optimal environment for nonpathogenic & well-adapted viruses to interact with the host, as well as for viral recombination.

Biofilms can also enhance virion viability in extracellular environments, such as on fomites and in aquatic sediments, allowing viral persistence and dissemination.

Viruses and other pathogens are often studied as stand-alone entities, despite that, in nature, they mostly live in multispecies associations called biofilms—both externally and within the host.
https://t.co/FBfXhUrH5d
Microorganisms in biofilms are enclosed by an extracellular matrix that confers protection and improves survival. Previous studies have shown that viruses can secondarily colonize preexisting biofilms, and viral biofilms have also been described.
...we raise the perspective that CoVs can persistently infect bats due to their association with biofilm structures. This phenomenon potentially provides an optimal environment for nonpathogenic & well-adapted viruses to interact with the host, as well as for viral recombination.
Biofilms can also enhance virion viability in extracellular environments, such as on fomites and in aquatic sediments, allowing viral persistence and dissemination.


