
Simple Moving Average is a widely used technical analysis tool. It’s simple yet very powerful !
Have you seen our Simple Moving Average Scans yet ? Check it out on the StockEdge App today ! @vivbajaj
#SMA #StocksToWatch #trading

More from StockEdge


A THREAD(🧵)....(1/7)
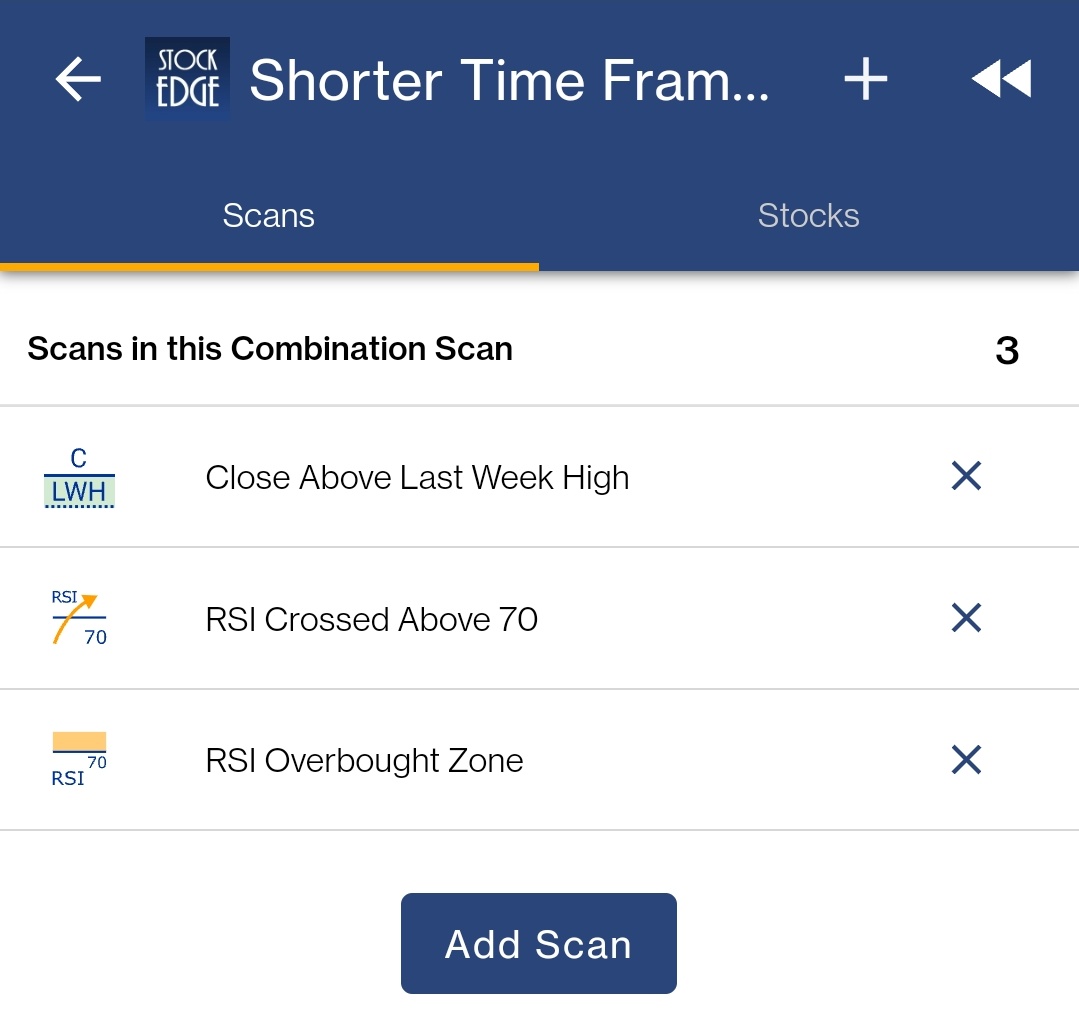
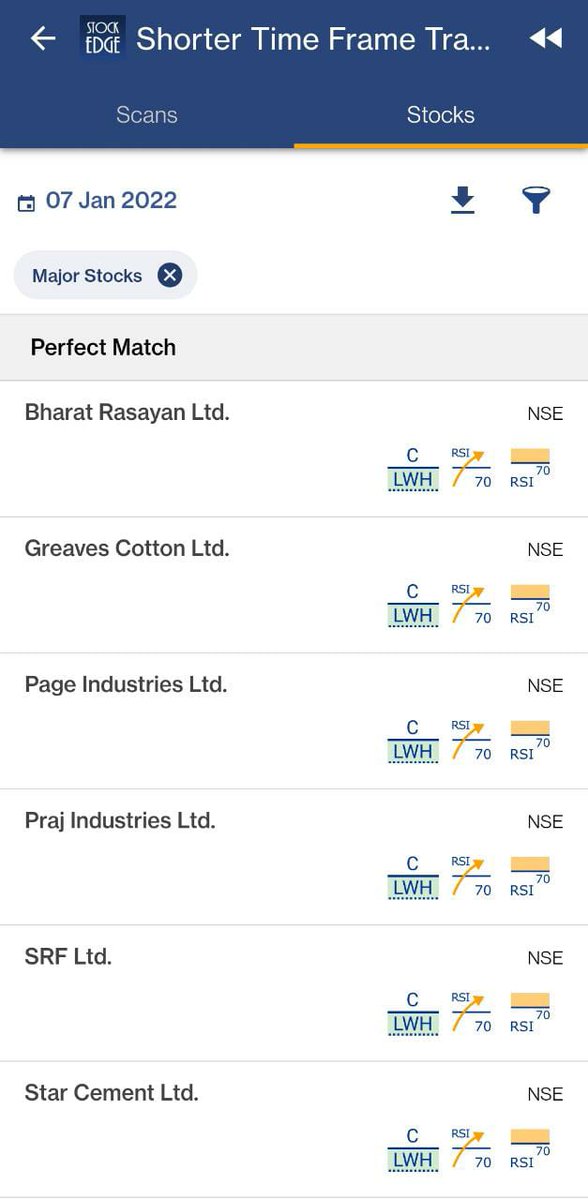
This Combo scan tries to filter stocks based on strong momentum for short term trades
(2/7)
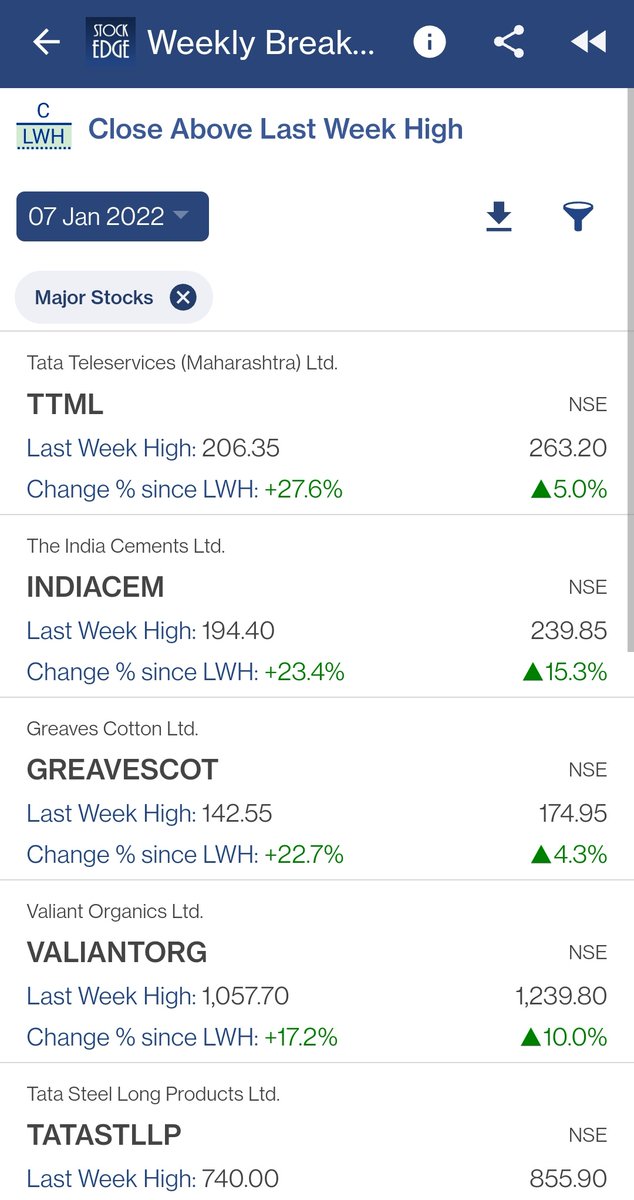
The first scan used here is Close Above Last Week High
https://t.co/ehv5ke8sxc
(3/7)
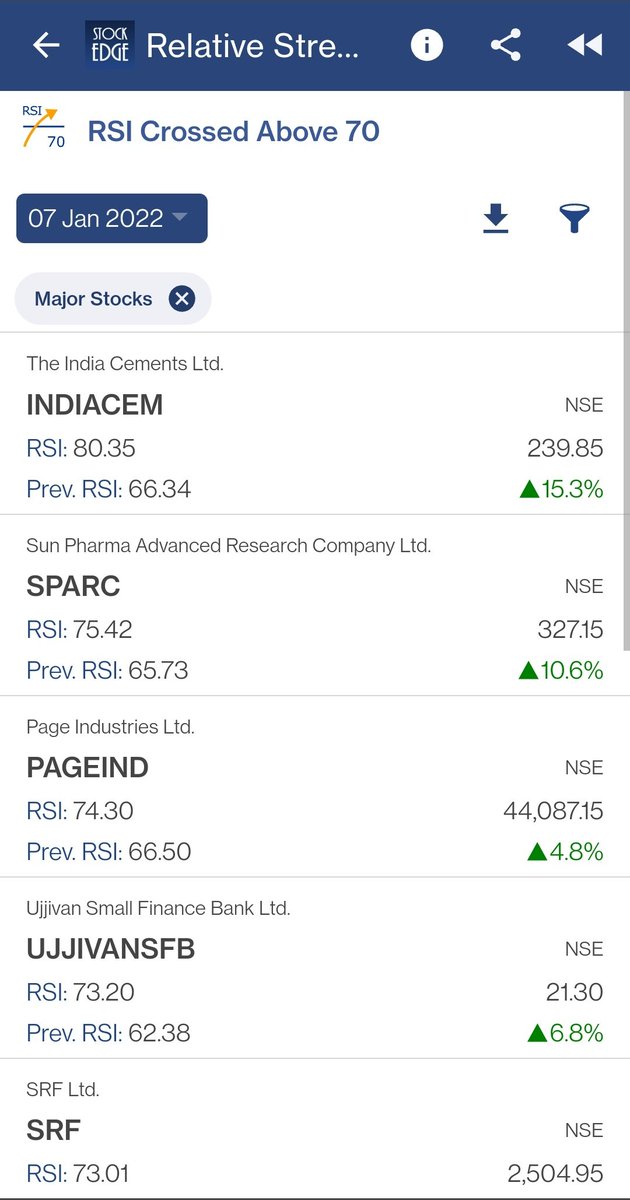
The Second Scan in the combo is RSI Crossed above 70 https://t.co/q4NpyFYuBD
(4/7)
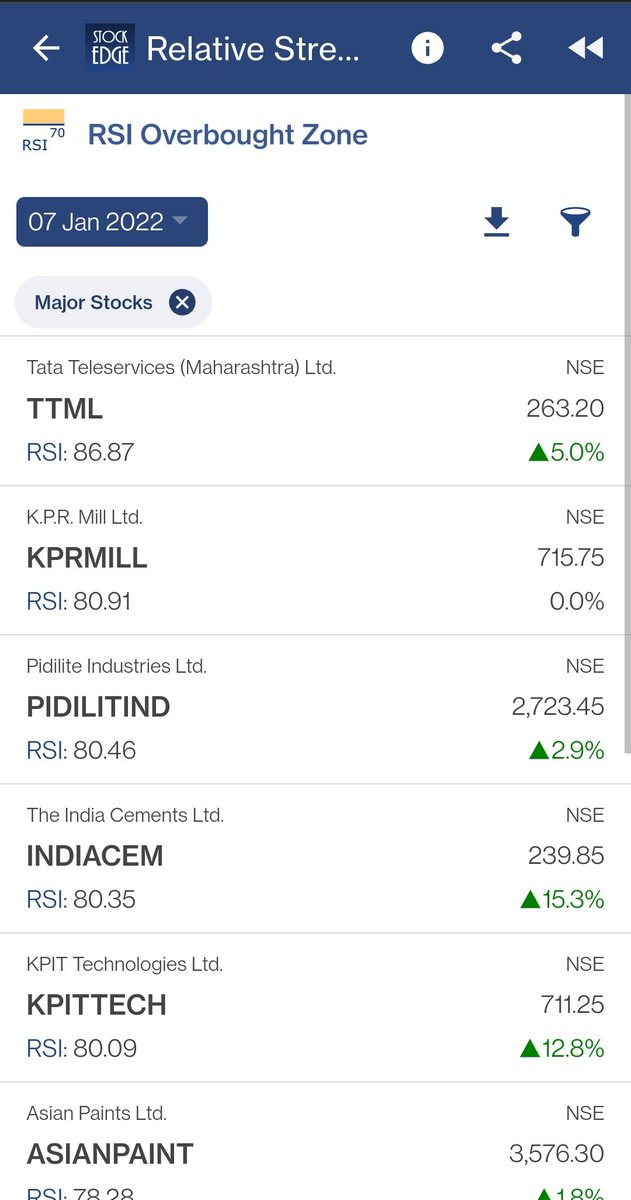
The Third Scan used here is RSI Overbought Zone https://t.co/5uZxwnLAUD
(5/7)
🧵...
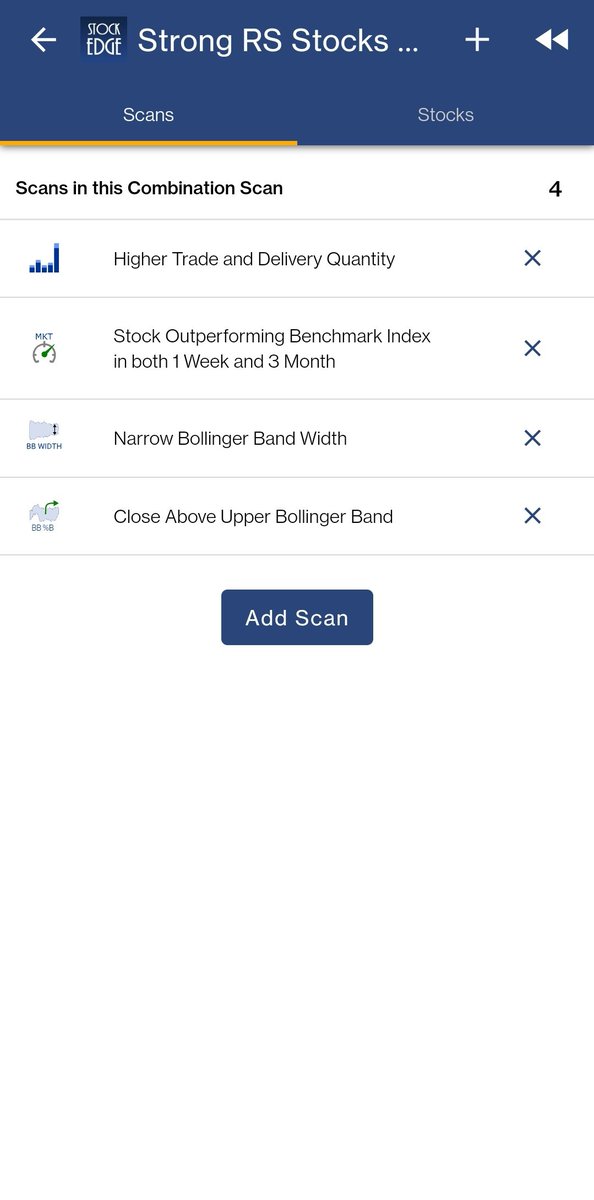
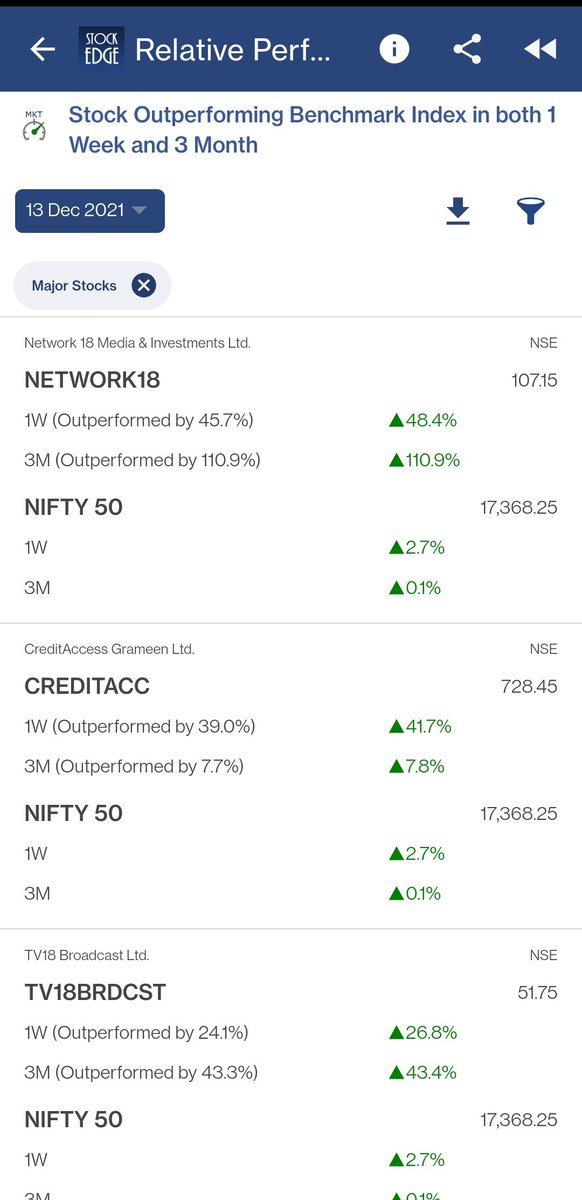
This combination scan identifies stocks that are outperforming Benchmark Indices in 1 week as well as 3 months time frame.
It also identities stocks that have consolidated in a narrow range for some time and breaks the zone with a higher trade & delivery quantity.
Some of the scans used in the combination include
-Higher Trade and Delivery Quantity https://t.co/9CiSwEADrF
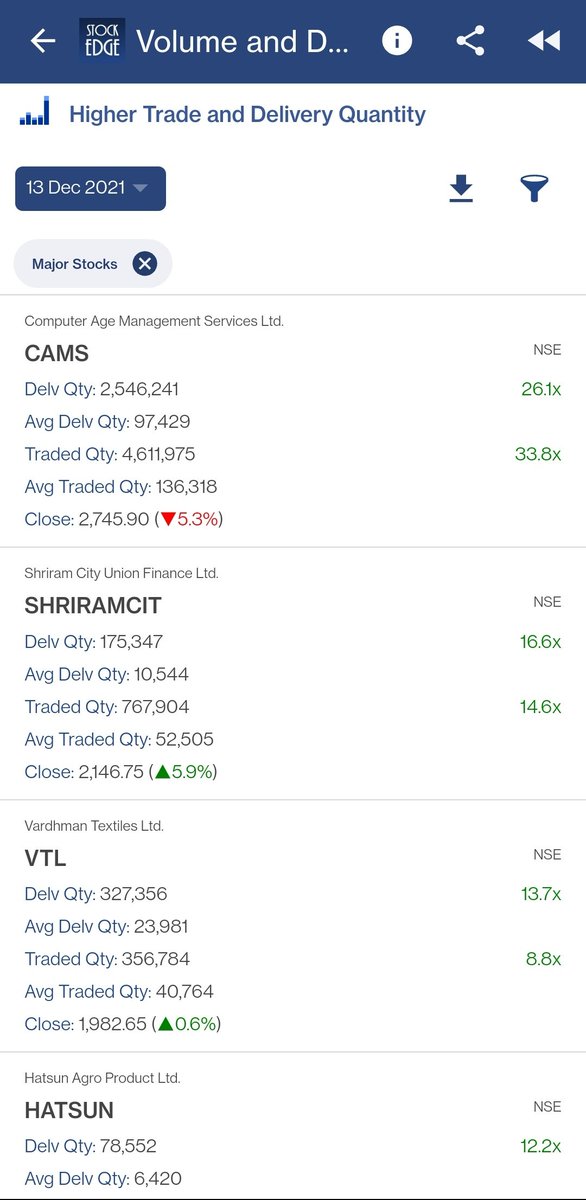
The second scan used here is Stocks Outperforming Benchmark Index in both 1 week and 3 month: https://t.co/dv9e3KK810
(🧵): https://t.co/6tUmyhrw47
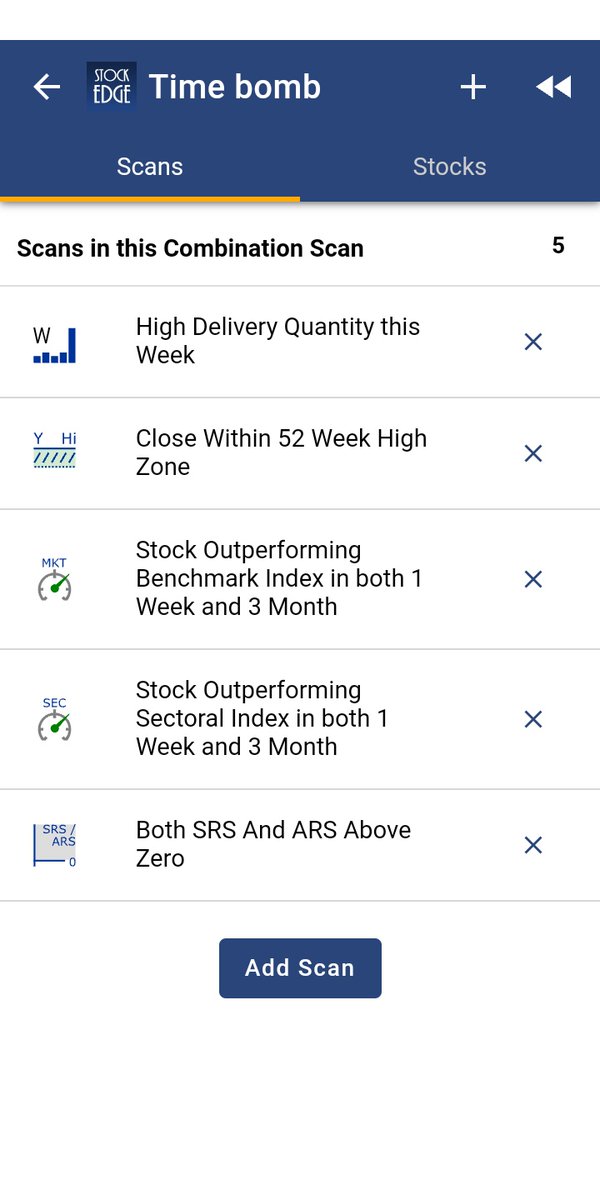
Stocks with a High Delivery, combined with a Close Within 52 week Zone are signs of strong momentum! https://t.co/arNYJst06d
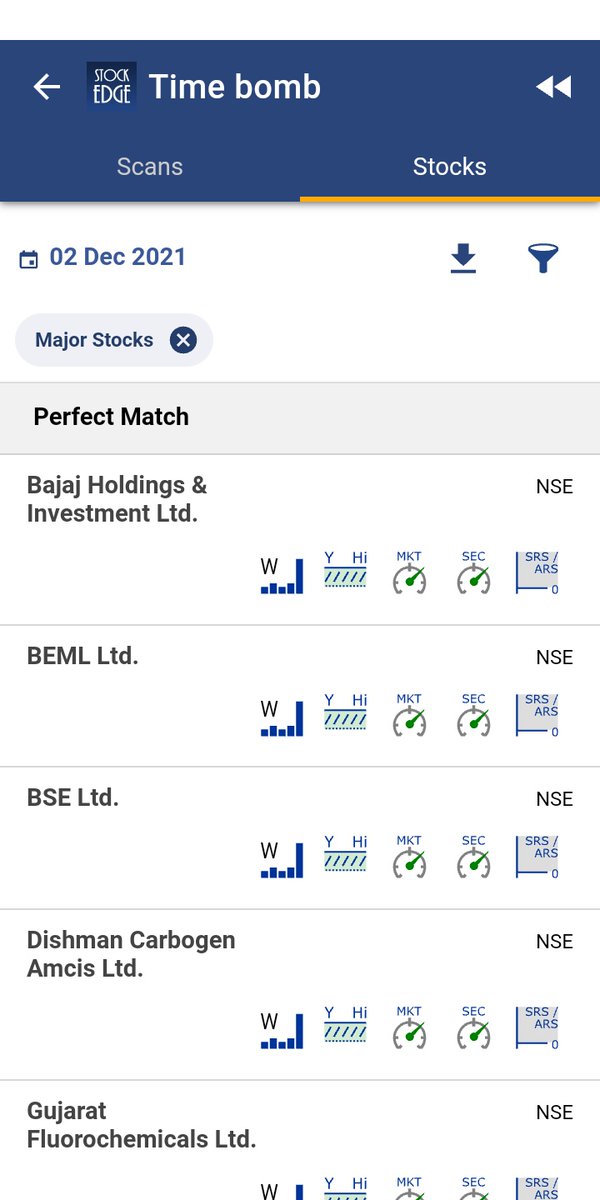
Relative Strength is a momentum indicator which signifies the ratio of a stock price performance compared to the market average performance:
Both Adaptive Relative Strength(ARS) and Static Relative Strength(SRS) above zero confirms its performance as better than Benchmark indexes!
Want to filter such stocks? Subscribe to StockEdge Premium and get these with a few clicks: https://t.co/5hmmLuqUFI
Use Code PREMIUM20 for 20% OFF!
More from Screeners


Do read it completely to understand the stance and the plan.
This thread will present a highly probable scenario of markets for the upcoming months. Will update the scenario too if there is a significant change in view in between.
— Aakash Gangwar (@akashgngwr823) May 15, 2022
1/n https://t.co/jfWOyEgZyd
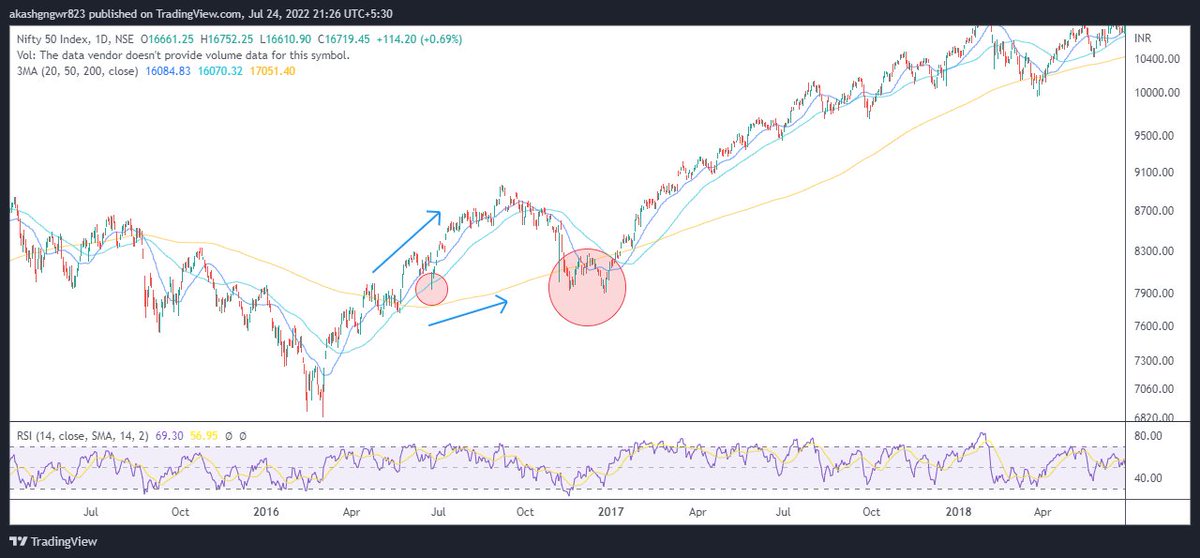
1. The moving average structure - Many traders just look at the 200 ma test or closing above/below it regardless of its slope. Let's look at all the interactions with 200 ma where price met it for the first time after the trend change but with 200 ma slope against it
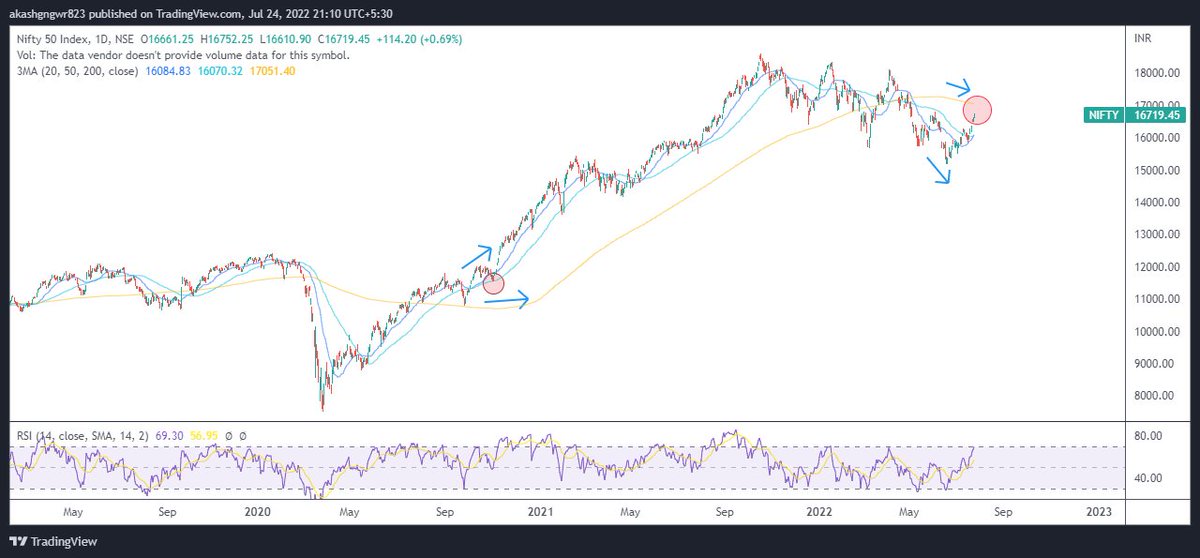
One can clearly sense that currently it is one of those scenarios only. I understand that I might get trolled for this, but an unbiased mind suggests that odds are highly against the bulls for making fresh investments.
But markets are good at giving surprises. What should be our stance if price kept on rising? Let's understand that through charts. The concept is still the same. Divergent 200 ma and price move results in 200 ma test atleast once which gives good investment opportunities.
2. Zig-Zag bear market- There are two types of fall in a bear market, the first one is vertical fall which usually ends with ending diagonals (falling wedges) and the second one is zig zag one which usually ends with parabolic down moves.

What does it mean?
7 tweets that will teach you about its basics (and much more):🧵
Collaborated with @niki_poojary
1/ What is CPR?
The basics of CPR, how it's calculated, and TC and BC in CPR.
User: @ZerodhaVarsity.
One can also gauge the trend whether bullish or bearish.
Explained in very simple words
@ZerodhaVarsity 2/ What are the Uses of CPR?
User: @YMehta_
A thread that provides examples along with the concept.
Also includes an Intraday Trading Setup on 5 min
#CPR is an indicator which is used for #Intraday in Stock Market.
— Yash Mehta (@YMehta_) November 19, 2021
This learning thread would be on
"\U0001d650\U0001d668\U0001d65a\U0001d668 \U0001d664\U0001d65b \U0001d63e\U0001d64b\U0001d64d"
Like\u2764\ufe0f& Retweet\U0001f501for wider reach and for more such learning thread in the future.
Also, an investment strategy is shared using CPR in the end.
1/24
@ZerodhaVarsity @YMehta_ 3/ How to analyze trends with CPR?
User: @cprbykgs
How to interpret CPR based on the candles forming either above or below the daily and weekly CPR.
He is the most famous guy when it comes to CPR, so go through his Twitter and Youtube
CPR indicator trend analysis:
— Gomathi Shankar (@cprbykgs) January 25, 2022
Candles below daily & weekly CPR \U0001f43b
Candles above daily CPR but below weekly CPR early confirmation of \U0001f402
Candles above daily + weekly CPR strong confirmation of \U0001f402
Isn\u2019t it simple?#cprbykgs #cprindicator #nifty #banknifty
@ZerodhaVarsity @YMehta_ @cprbykgs 4/ Interpreting longer timeframes with CPR
User: @cprbykgs
Trend Reversals with CPR when the trend is bullish and it enters the daily CPR
#banknifty
— Gomathi Shankar (@cprbykgs) July 9, 2021
Candles above monthly CPR- Bullish
Candles above weekly CPR- Bullish
Now, whenever candles enter daily CPR range it indicates weakness of current trend & early signs of trend reversal.
So, wait for the candles to exit the daily CPR range then take the trade. (1/4) pic.twitter.com/7vaaLMCrV8
You May Also Like


On Sunday 21st June, 14 year old Noah Donohoe left his home to meet his friends at Cave Hill Belfast to study for school. #RememberMyNoah💙

He was on his black Apollo mountain bike, fully dressed, wearing a helmet and carrying a backpack containing his laptop and 2 books with his name on them. He also had his mobile phone with him.
On the 27th of June. Noah's naked body was sadly discovered 950m inside a storm drain, between access points. This storm drain was accessible through an area completely unfamiliar to him, behind houses at Northwood Road. https://t.co/bpz3Rmc0wq
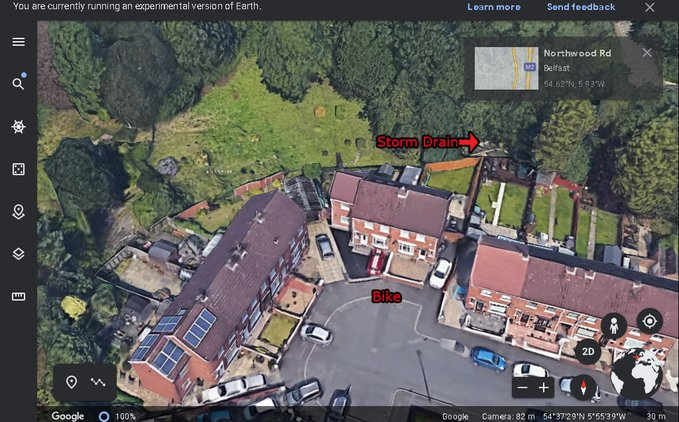
"Noah's body was found by specially trained police officers between two drain access points within a section of the tunnel running under the Translink access road," said Mr McCrisken."
Noah's bike was also found near a house, behind a car, in the same area. It had been there for more than 24 hours before a member of public who lived in the street said she read reports of a missing child and checked the bike and phoned the police.