Cognitive Bias in Forensic Pathology Decisions was published today by Journal of Forensic Sciences

More from Science

I want to share my thoughts, as someone who has been so alarmed by the so-called "dissident" scientists like Gupta, Heneghan, Kuldorff, Bhattacharya, & Ioannidis who consider themselves brave Galileos unfairly treated by "establishment scientists." I will try not to swear. 1/n
I want to talk about 3 things:
‼️Their fringe views are inhumane, unethical junk science that promotes harm
‼️They complain that they've been marginalized but this is simply untrue
‼️I am sick of people telling me we have to "listen to both sides." There aren't 2 sides here 2/n
These 'dissident' scientists have consistently downplayed COVID-19, urging policymakers not to take aggressive control measures. They claim it is not a serious threat. Gupta even went on TV saying people under 65 shouldn't worry about it!
RECEIPTS
They have consistently argued that policymakers should just let the virus rip, in an attempt to reach herd immunity by natural infection. Kuldorff *continues* to argue for this even now that we have many highly effective, safe vaccines.
We've never controlled a deadly, contagious pandemic before by just letting the virus spread, as this approach kills & disables too many people. In Manaus, Brazil, 66% of the city was infected & an astonishing *1 in 500* people died of COVID-19
If this is true raises the question of why certain (fringe & unethical) views got access to No.10 while others were ignored... https://t.co/A75HrSEqo4
— Prof. Devi Sridhar (@devisridhar) December 13, 2020
I want to talk about 3 things:
‼️Their fringe views are inhumane, unethical junk science that promotes harm
‼️They complain that they've been marginalized but this is simply untrue
‼️I am sick of people telling me we have to "listen to both sides." There aren't 2 sides here 2/n
These 'dissident' scientists have consistently downplayed COVID-19, urging policymakers not to take aggressive control measures. They claim it is not a serious threat. Gupta even went on TV saying people under 65 shouldn't worry about it!
RECEIPTS
They have consistently argued that policymakers should just let the virus rip, in an attempt to reach herd immunity by natural infection. Kuldorff *continues* to argue for this even now that we have many highly effective, safe vaccines.
Focused Protection: The Middle Ground between Lockdowns and "Let-it-rip". An essay by Jay Bhattacharya (@Stanford), @SunetraGupta (@UniofOxford) and @MartinKulldorff (@Harvard). https://t.co/T8uLxSFwgh
— Martin Kulldorff (@MartinKulldorff) December 11, 2020
We've never controlled a deadly, contagious pandemic before by just letting the virus spread, as this approach kills & disables too many people. In Manaus, Brazil, 66% of the city was infected & an astonishing *1 in 500* people died of COVID-19


#DDDD $LBPS $LOAC
A thread on the potential near term catalysts behind why I have increased my position in 4d Pharma @4dpharmaplc (LON: #DDDD):

1) NASDAQ listing. This is the most obvious.
The idea behind this is that the huge pool of capital and institutional interest in the NASDAQ will enable a higher per-share valuation for #DDDD than was achievable in the UK.
Comparators to @4dpharmaplc #DDDD (market capitalisation £150m) on the NASDAQ and their market capitalisation:
Seres Therapeutics: $2.33bn = £1.72bn (has had a successful phase 3 C. difficile trial); from my previous research (below) the chance of #DDDD achieving this at least once is at least
Kaleido Biosciences: $347m = £256m. 4 products under consideration, compared to #DDDD's potential 16. When you view @4dpharmaplc's 1000+ patents and AI-driven MicroRx platform (not to mention their end-to-end manufacturing capability), 4d's undervaluation is clear.
A thread on the potential near term catalysts behind why I have increased my position in 4d Pharma @4dpharmaplc (LON: #DDDD):
1) NASDAQ listing. This is the most obvious.
The idea behind this is that the huge pool of capital and institutional interest in the NASDAQ will enable a higher per-share valuation for #DDDD than was achievable in the UK.
Comparators to @4dpharmaplc #DDDD (market capitalisation £150m) on the NASDAQ and their market capitalisation:
Seres Therapeutics: $2.33bn = £1.72bn (has had a successful phase 3 C. difficile trial); from my previous research (below) the chance of #DDDD achieving this at least once is at least
While looking at speculative pharmaceutical stocks I am reminded of why I am averse to these risky picks.#DDDD was compelling enough, though, to break this rule. The 10+ treatments under trial, industry-leading IP portfolio, and comparable undervaluation are inescapable.
— Shrey Srivastava (@BlogShrey) December 16, 2020
Kaleido Biosciences: $347m = £256m. 4 products under consideration, compared to #DDDD's potential 16. When you view @4dpharmaplc's 1000+ patents and AI-driven MicroRx platform (not to mention their end-to-end manufacturing capability), 4d's undervaluation is clear.


So it turns out that an organization I thought was doing good work, the False Memory Syndrome Foundation (associated with Center for Inquiry, James Randi, and Martin Gardner) was actually caping for pedophiles. Uhhhh oops?
Since this, bizarrely, turned out to be one of my longest videos ever (??) here's a quick thread to sum it up for those of you like myself with short attention spans. 1/10
In the '90s the False Memory Syndrome Foundation was founded to call attention to the problem of adults suddenly "remembering" child abuse that never actually happened, often under hypnosis. Skeptics like James Randi & Martin Gardner joined their board. 2/10
A new article reveals that the FMSF was founded by parents who had been credibly and PRIVATELY accused of molestation by their now-adult daughter. They publicized the accusation, destroyed the daughter's reputation, and started the foundation. 3/10
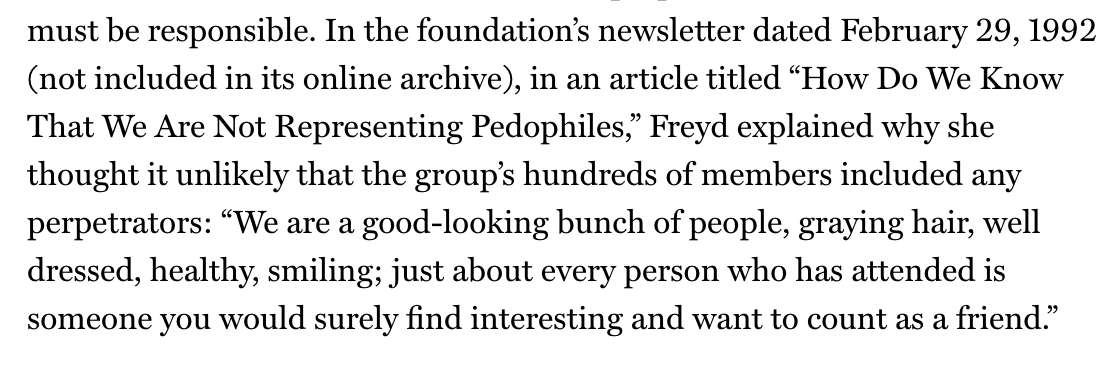
The FMSF assumed any accused pedo who joined was innocent, saying "We are a good-looking bunch of people, graying hair, well dressed, healthy, smiling; just about every person who has attended is someone you would surely find interesting and want to count as a friend" 😬 4/10
I was Wrong about False Memories: Satanic Panic, Pedophiles, Ted Bundy, and the Lost in the Mall Studies https://t.co/6XKTfGOqwl
— skepchicks (@skepchicks) January 15, 2021
Since this, bizarrely, turned out to be one of my longest videos ever (??) here's a quick thread to sum it up for those of you like myself with short attention spans. 1/10
In the '90s the False Memory Syndrome Foundation was founded to call attention to the problem of adults suddenly "remembering" child abuse that never actually happened, often under hypnosis. Skeptics like James Randi & Martin Gardner joined their board. 2/10
A new article reveals that the FMSF was founded by parents who had been credibly and PRIVATELY accused of molestation by their now-adult daughter. They publicized the accusation, destroyed the daughter's reputation, and started the foundation. 3/10
The FMSF assumed any accused pedo who joined was innocent, saying "We are a good-looking bunch of people, graying hair, well dressed, healthy, smiling; just about every person who has attended is someone you would surely find interesting and want to count as a friend" 😬 4/10