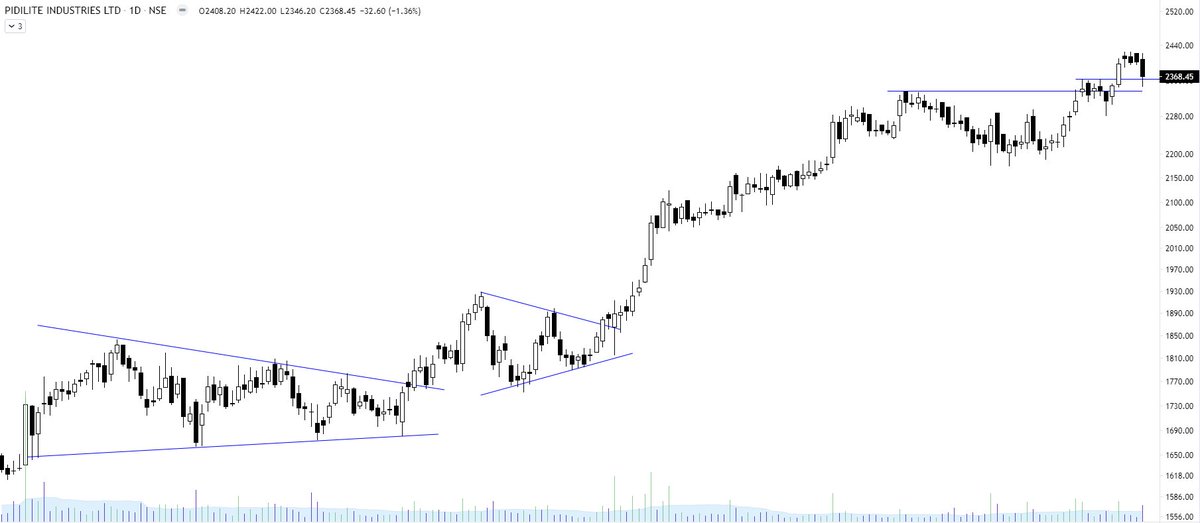
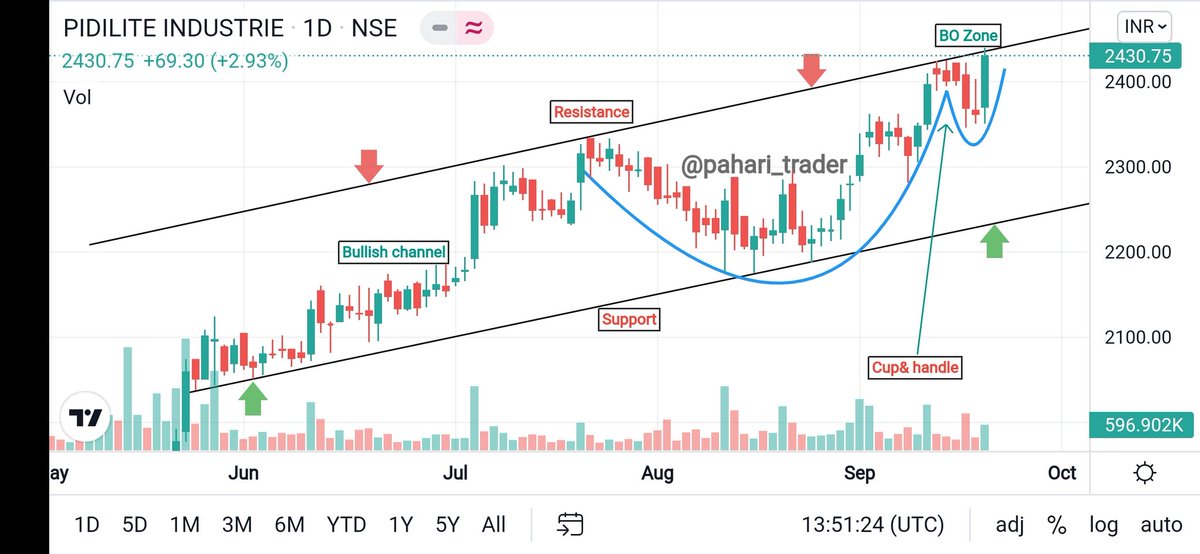
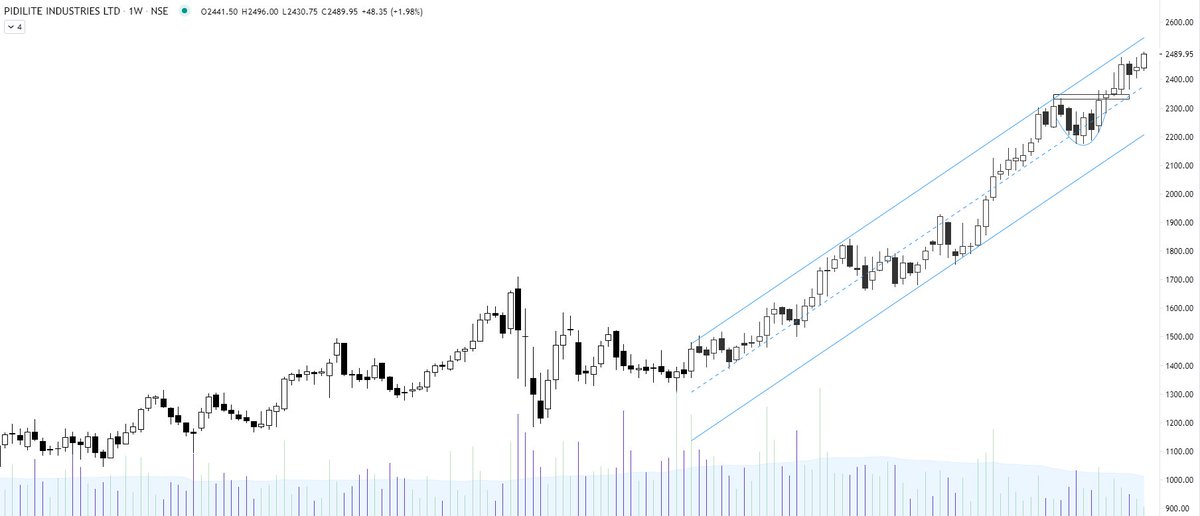
#PIDILITIND long term chart, sustaining below 2100, can fall towards 1500 over time, Weekly RSI & MACD quite weak, stock has pulled back to breakdown level
#Nifty #stock #stocks
Not trading call, academic post

More from Techno Prince
Pls go to Nifty daily chart, convert candle stick chart to line chart
Make time period Weekly
Then click on the encircled + sign in top panel to add different index to compare, u can add any index
Will describe this in our Friday post market session, watch in SE YouTube channel
Make time period Weekly
Then click on the encircled + sign in top panel to add different index to compare, u can add any index
Will describe this in our Friday post market session, watch in SE YouTube channel
Sir can u please make a video on how to get this plotted in trading view .Please sir .a small guidance will be highly appreciated .I know there are many like me who don't know to plot it but are shy to admit .it would benefit them too .thank u sir
— rajesh shetty (@shettyrajeshs) May 4, 2021


More from Pidilite

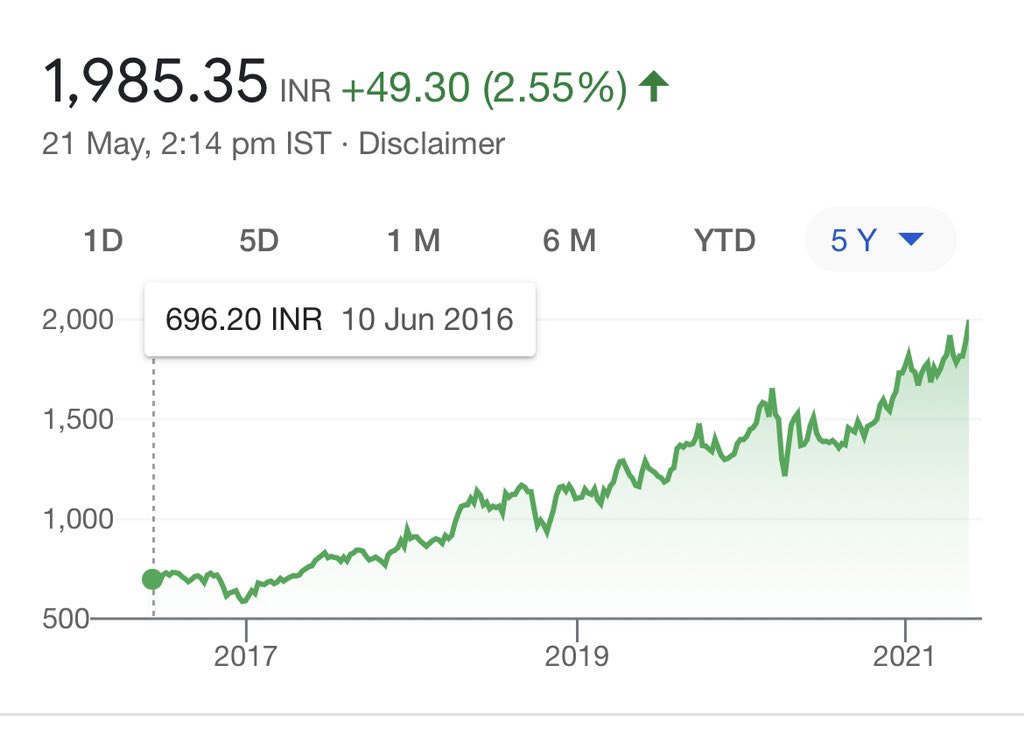

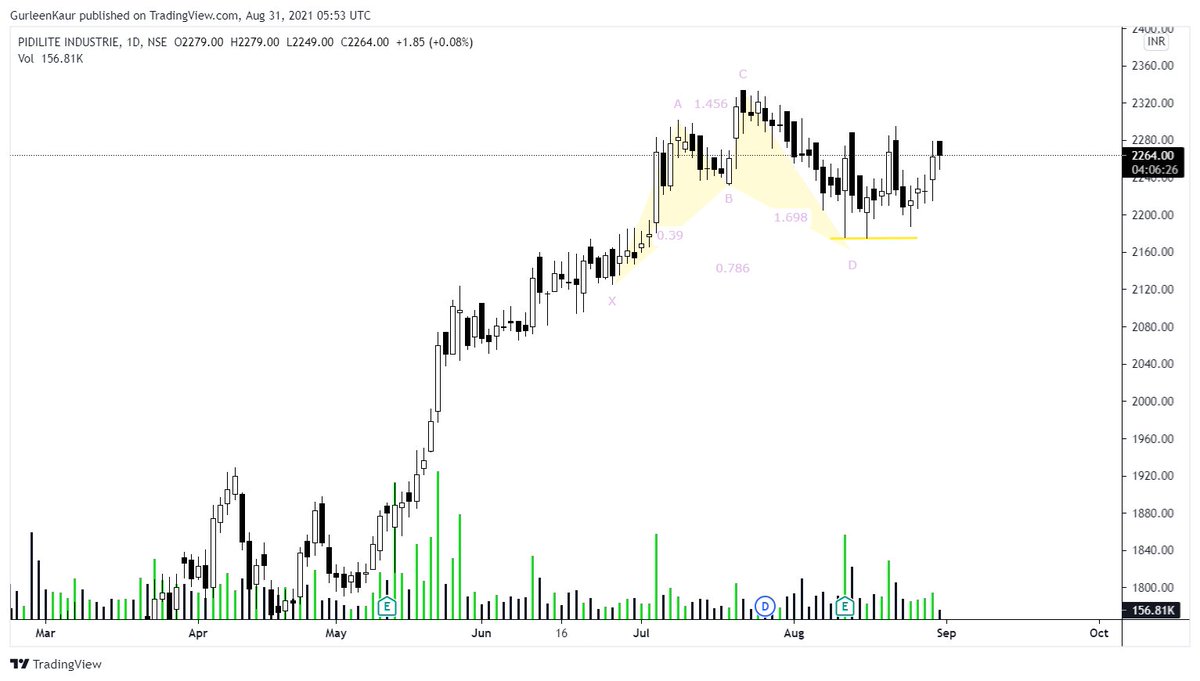
#PIDILITE Update
Swinging in a range post reversal from Point D.
In weekly; Converging trendlines along with declining volume as the price progresses is progressing.
Targets remain intact at 2320 and 2380.
#StockMarket #StockToWatch https://t.co/8q988LZ5Er
as the price is progressing*
Swinging in a range post reversal from Point D.
In weekly; Converging trendlines along with declining volume as the price progresses is progressing.
Targets remain intact at 2320 and 2380.
#StockMarket #StockToWatch https://t.co/8q988LZ5Er
#PIDILITE
— Gurleen (@GurleenKaur_19) August 12, 2021
Price volume action.
The setup looks good above 2273.40 for targets of 2320 followed by 2380.
[On Watchlist] #StockMarket #StocksInFocus pic.twitter.com/8htyGPIjEl
as the price is progressing*