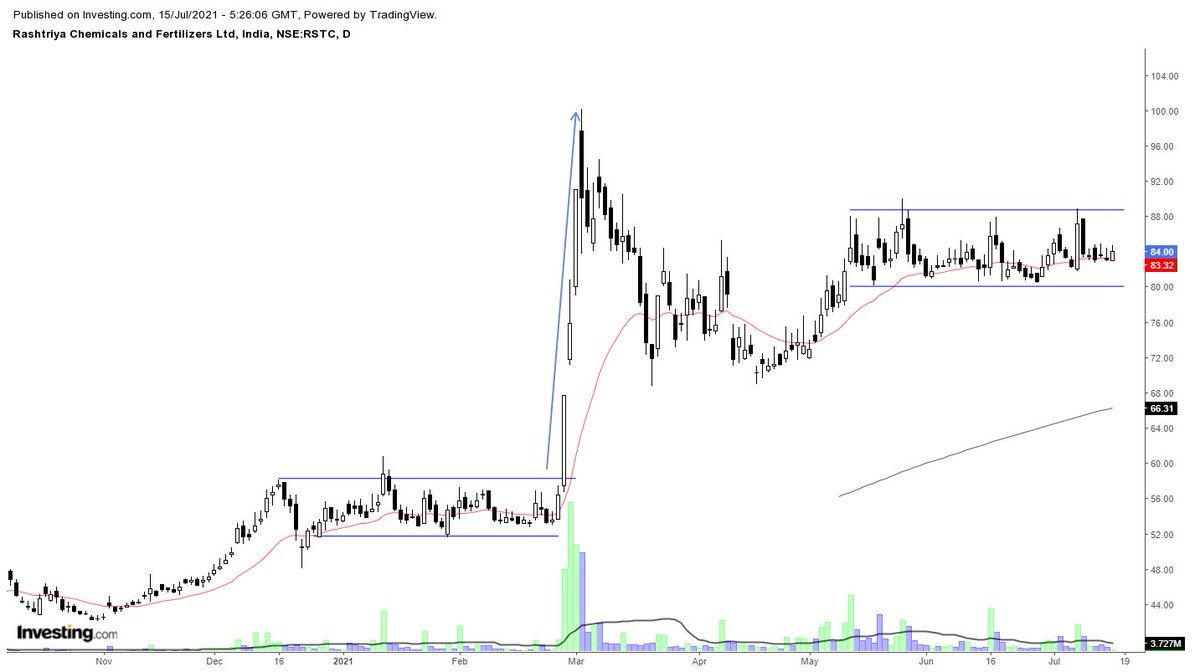
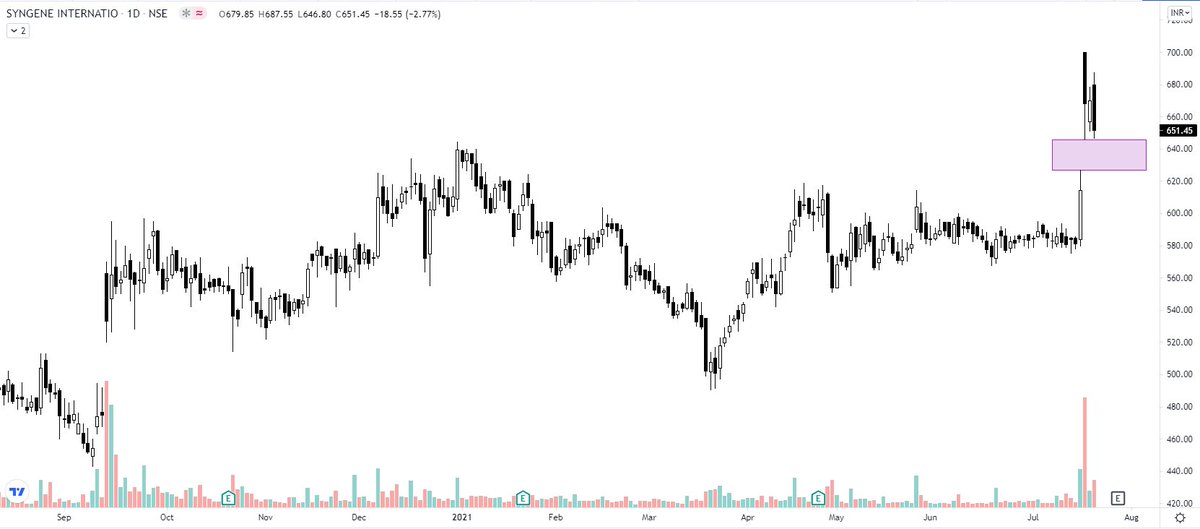
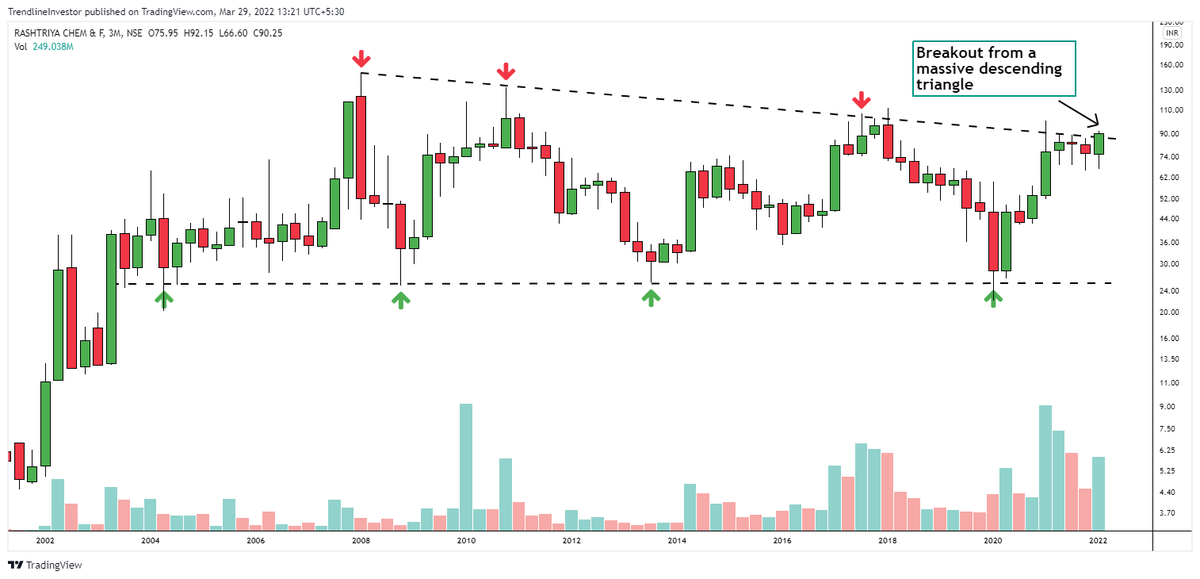
Rashtriya Chemicals & Fertilizers RCF -
a chart that caught my attention immediately. My favorite horizontal range with volume contraction. Will wait for breakout/breakdown in this. Lots of big green candles in the range. On radar.
More from Steve Nison
although a must-have portfolio stock. Faced resistance right at the upper channel boundary. Volumes high. Any retracement back to the lower boundary will be an opportunity to accumulate. https://t.co/5uDsUXsbPP
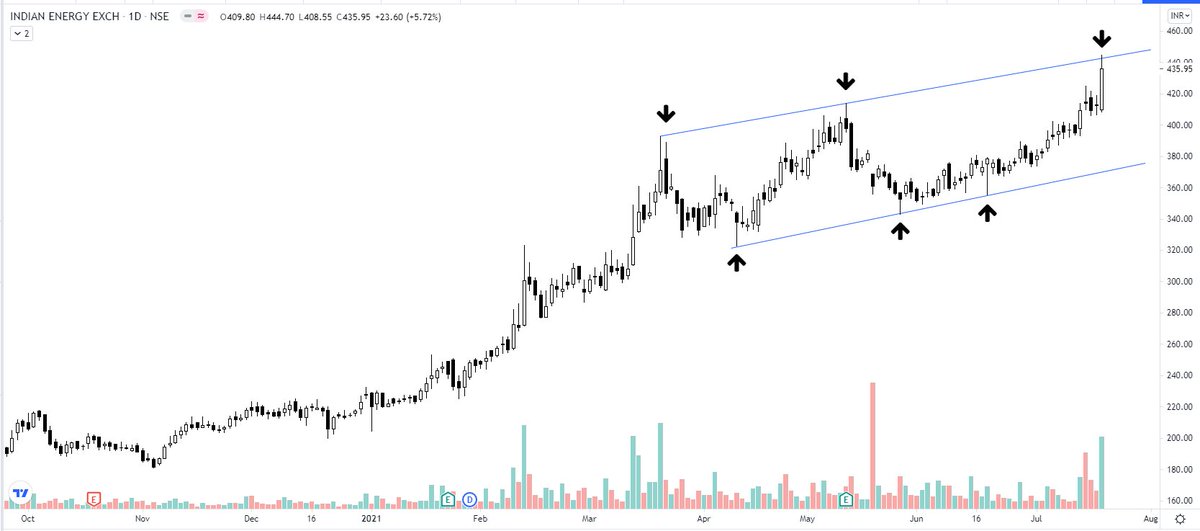
IEX - the resistance turning support. Kindly review, please. @nishkumar1977 @suru27 @rohanshah619 @indian_stockss @sanstocktrader @BissaGauravB @RajarshitaS @PAVLeader @Rishikesh_ADX @VijayThk @Investor_Mohit @TrendTrader85 pic.twitter.com/7CCzmee5If
— Steve Nison (@nison_steve) December 18, 2020
More from Rcf


You May Also Like

RT-PCR corona (test) scam
Symptomatic people are tested for one and only one respiratory virus. This means that other acute respiratory infections are reclassified as
4/10
— Dr. Thomas Binder, MD (@Thomas_Binder) October 22, 2020
...indication, first of all that testing for a (single) respiratory virus is done outside of surveillance systems or need for specific therapy, but even so the lack of consideration of Ct, symptoms and clinical findings when interpreting its result. https://t.co/gHH6kwRdZG
2/12
It is tested exquisitely with a hypersensitive non-specific RT-PCR test / Ct >35 (>30 is nonsense, >35 is madness), without considering Ct and clinical context. This means that more acute respiratory infections are reclassified as
6/10
— Dr. Thomas Binder, MD (@Thomas_Binder) October 22, 2020
The neither validated nor standardised hypersensitive RT-PCR test / Ct 35-45 for SARS-CoV-2 is abused to mislabel (also) other diseases, especially influenza, as COVID-19.https://t.co/AkFIfTCTkS
3/12
The Drosten RT-PCR test is fabricated in a way that each country and laboratory perform it differently at too high Ct and that the high rate of false positives increases massively due to cross-reaction with other (corona) viruses in the "flu
External peer review of the RTPCR test to detect SARS-CoV-2 reveals 10 major scientific flaws at the molecular and methodological level: consequences for false positive results.https://t.co/mbNY8bdw1p pic.twitter.com/OQBD4grMth
— Dr. Thomas Binder, MD (@Thomas_Binder) November 29, 2020
4/12
Even asymptomatic, previously called healthy, people are tested (en masse) in this way, although there is no epidemiologically relevant asymptomatic transmission. This means that even healthy people are declared as COVID
Thread web\u2b06\ufe0f\u2b07\ufe0f
— Dr. Thomas Binder, MD (@Thomas_Binder) December 16, 2020
The fabrication of the "asymptomatic (super) spreader" is the coronation of the total nons(ci)ense in the belief system of #CoronasWitnesses.
Asymptomatic transmission 0.7%; 95% CI 0%-4.9% - could well be 0%!https://t.co/VeZTzxXfvT
5/12
Deaths within 28 days after a positive RT-PCR test from whatever cause are designated as deaths WITH COVID. This means that other causes of death are reclassified as
8/8
— Dr. Thomas Binder, MD (@Thomas_Binder) March 24, 2020
By the way, who the f*** created this obviously (almost) worldwide definition of #CoronaDeath?
This is not only medical malpractice, this is utterly insane!https://t.co/FFsTx4L2mw

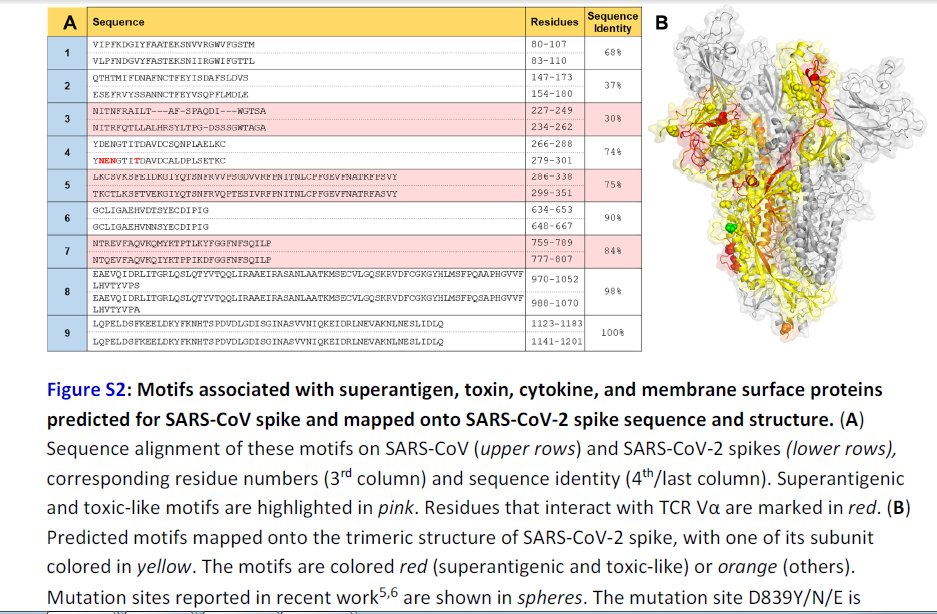
Further Examination of the Motif near PRRA Reveals Close Structural Similarity to the SEB Superantigen as well as Sequence Similarities to Neurotoxins and a Viral SAg.
The insertion PRRA together with 7 sequentially preceding residues & succeeding R685 (conserved in β-CoVs) form a motif, Y674QTQTNSPRRAR685, homologous to those of neurotoxins from Ophiophagus (cobra) and Bungarus genera, as well as neurotoxin-like regions from three RABV strains
(20) (Fig. 2D). We further noticed that the same segment bears close similarity to the HIV-1 glycoprotein gp120 SAg motif F164 to V174.
https://t.co/EwwJOSa8RK
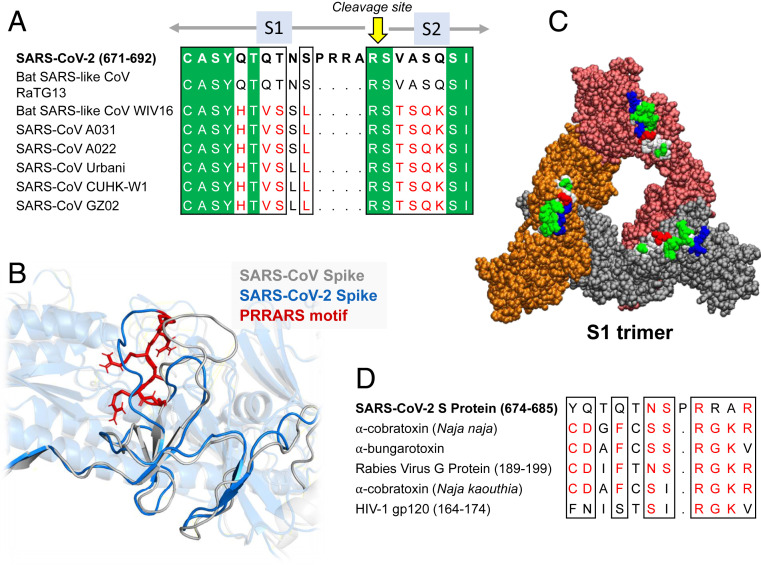
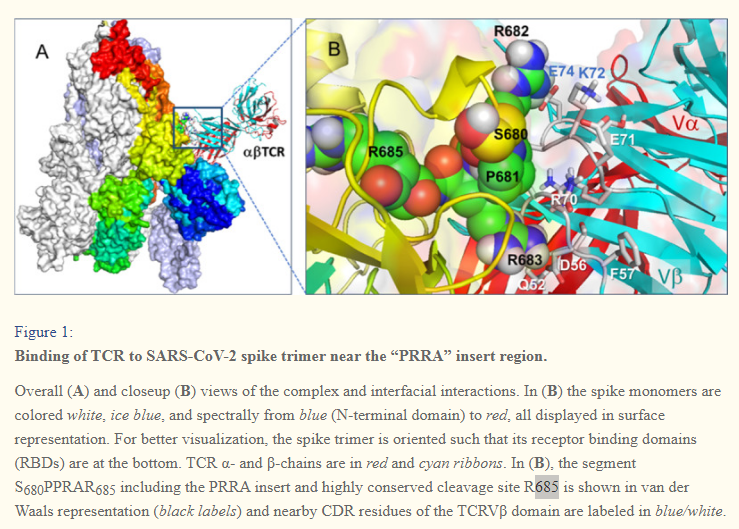
In (B), the segment S680PPRAR685 including the PRRA insert and highly conserved cleavage site *R685* is shown in van der Waals representation (black labels) and nearby CDR residues of the TCRVβ domain are labeled in blue/white
https://t.co/BsY8BAIzDa
Sequence Identity %
https://t.co/BsY8BAIzDa
Y674 - QTQTNSPRRA - R685
Similar to neurotoxins from Ophiophagus (cobra) & Bungarus genera & neurotoxin-like regions from three RABV strains
T678 - NSPRRA- R685
Superantigenic core, consistently aligned against bacterial or viral SAgs