What is Relative Strength and how can it be used for trading?
Learn all about this Momentum Indicator: https://t.co/5KcE7kY6cp
#technicalanalysis #trading #rsi
More from StockEdge


A THREAD(🧵)....(1/7)
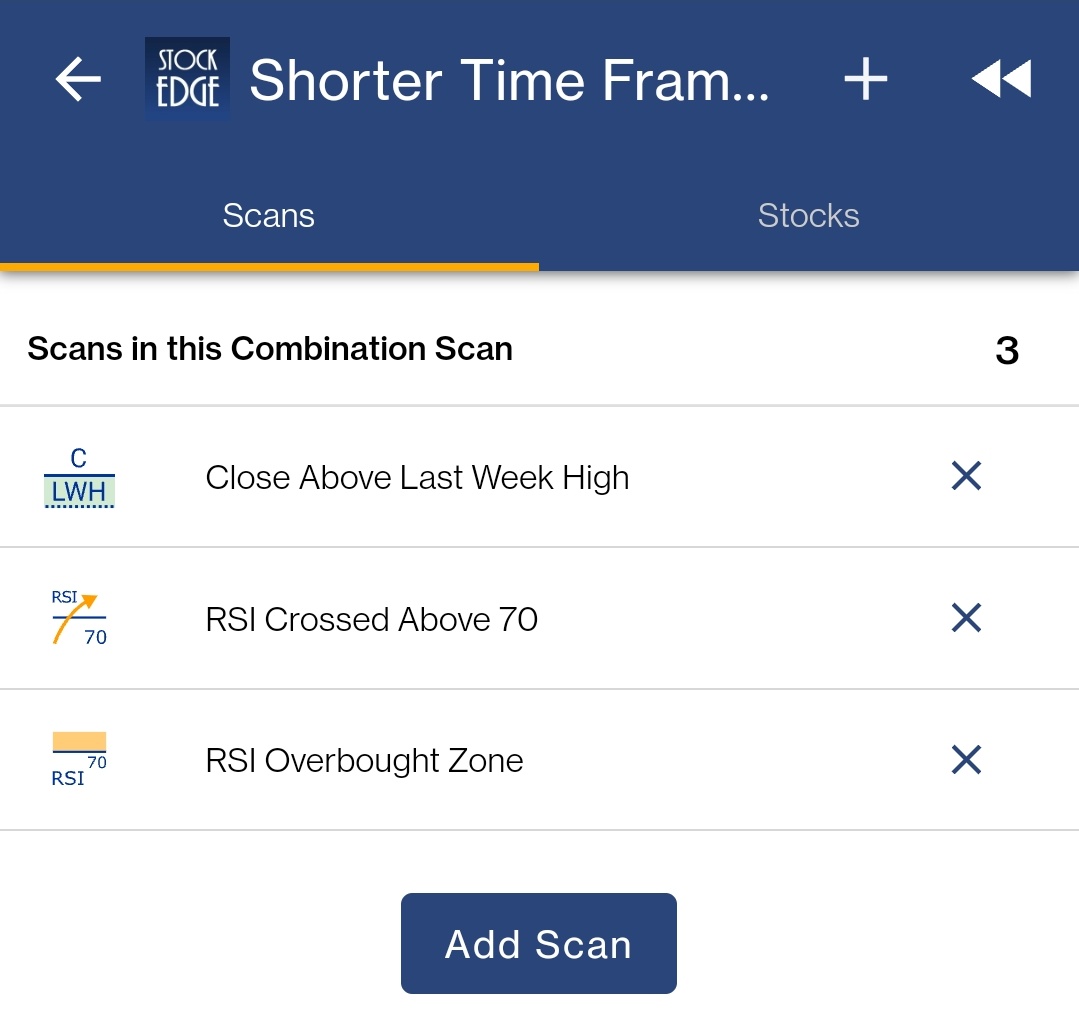
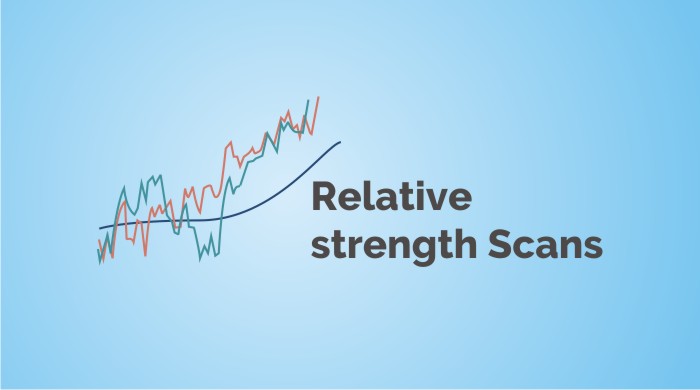
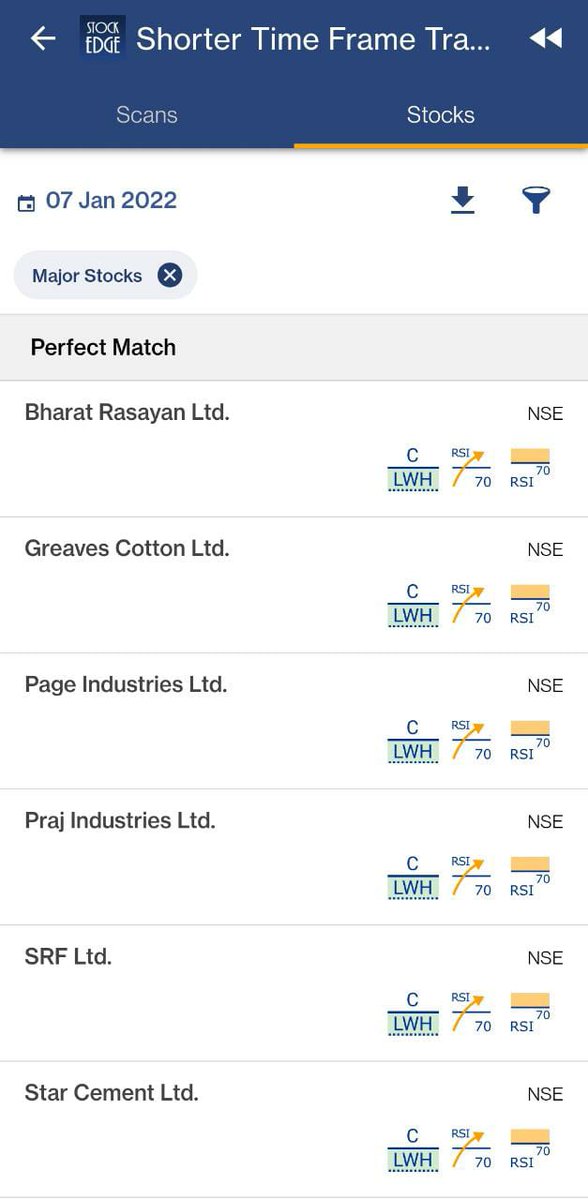
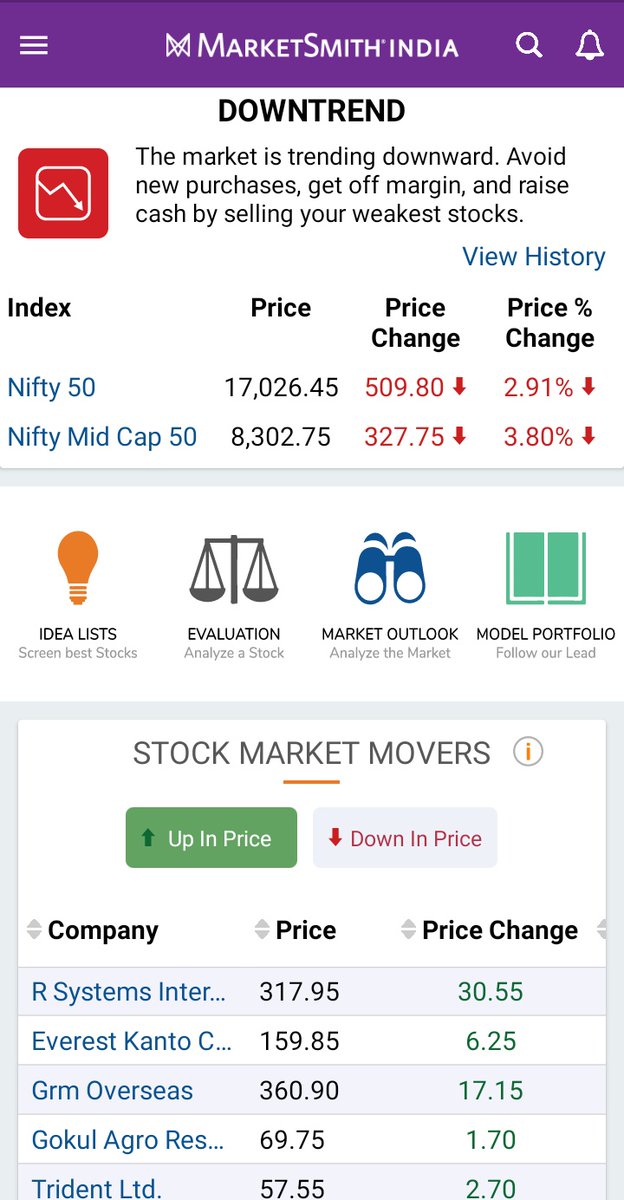
This Combo scan tries to filter stocks based on strong momentum for short term trades
(2/7)
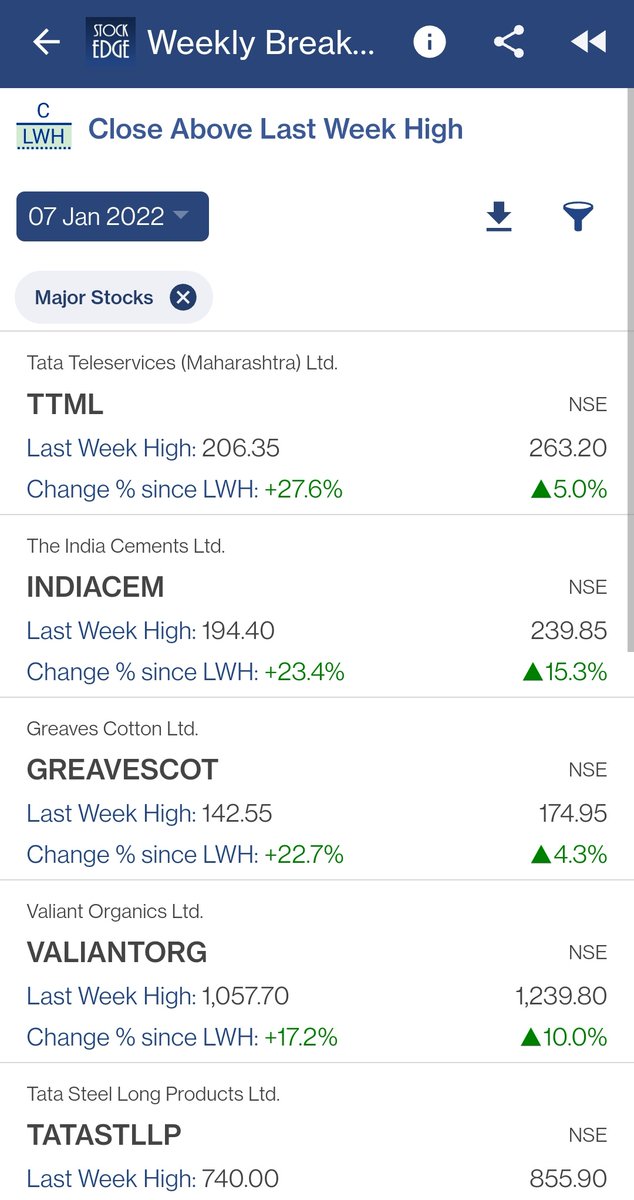
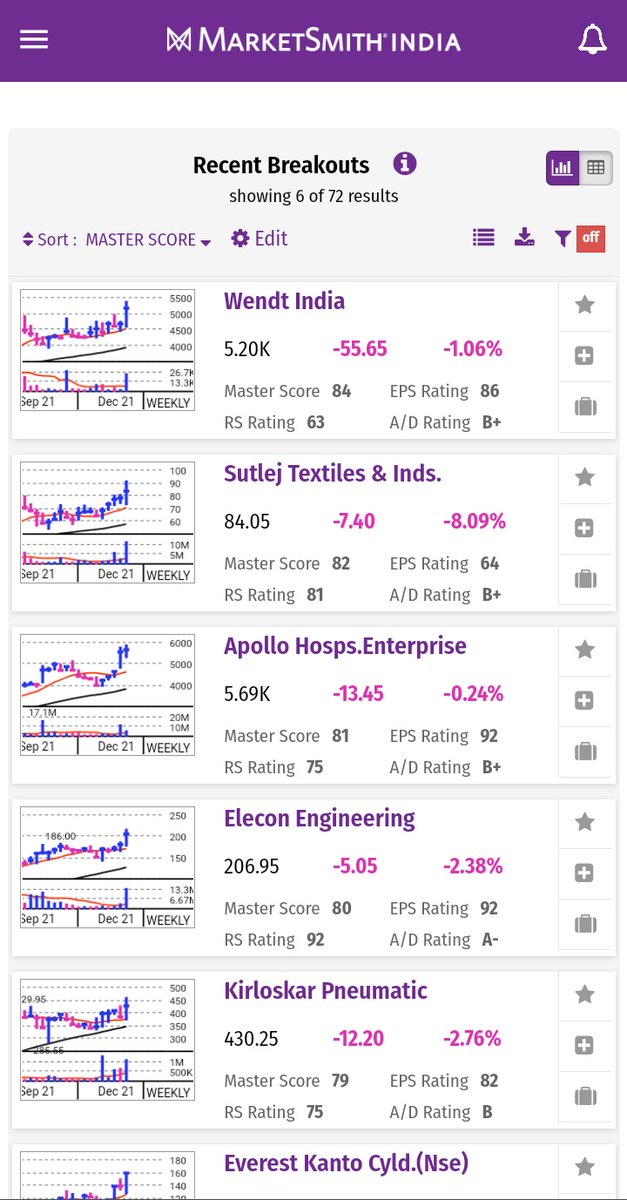
The first scan used here is Close Above Last Week High
https://t.co/ehv5ke8sxc
(3/7)
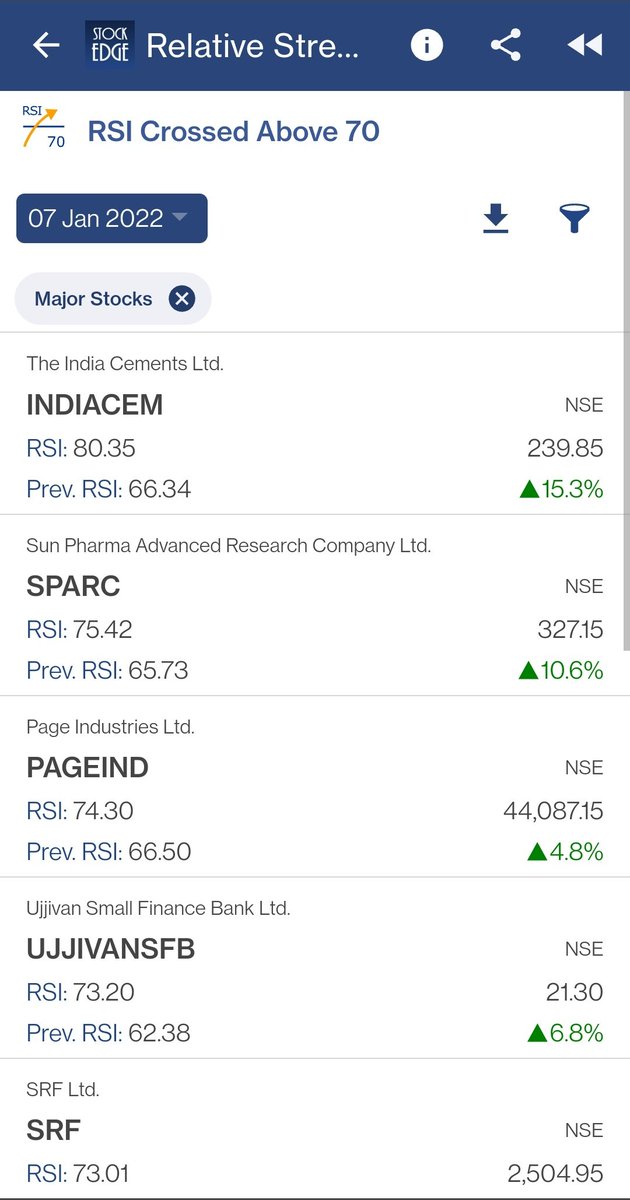
The Second Scan in the combo is RSI Crossed above 70 https://t.co/q4NpyFYuBD
(4/7)
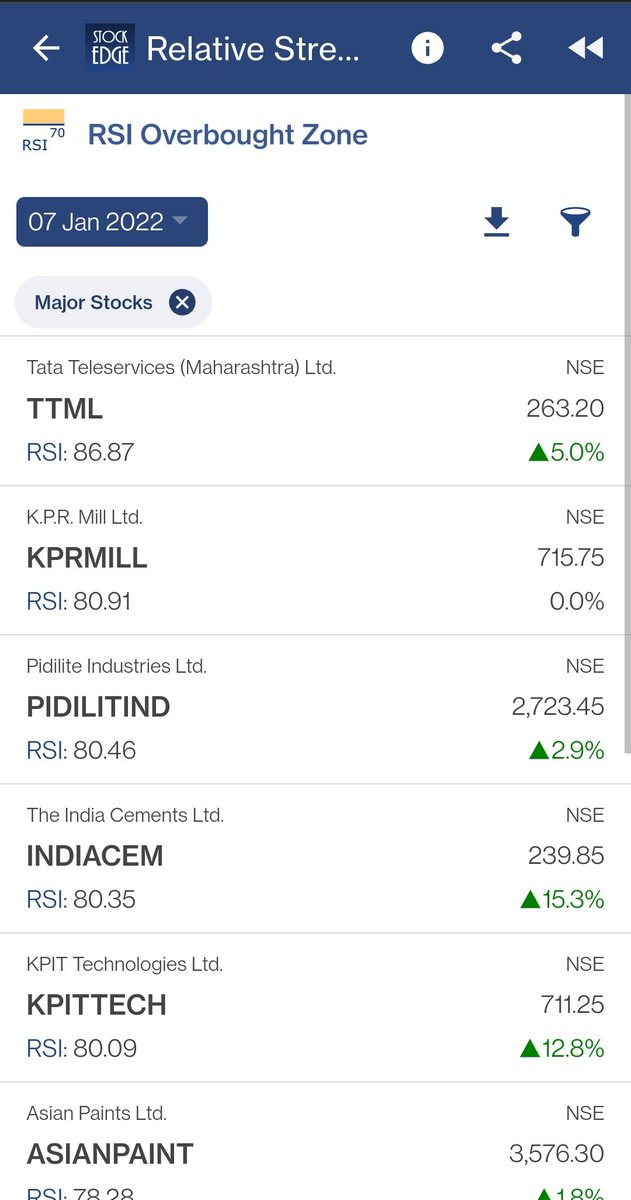
The Third Scan used here is RSI Overbought Zone https://t.co/5uZxwnLAUD
(5/7)
More from Rs


This learning thread would be on
"𝙐𝙨𝙚𝙨 𝙤𝙛 𝙍𝙚𝙡𝙖𝙩𝙞𝙫𝙚 𝙎𝙩𝙧𝙚𝙣𝙜𝙩𝙝"
Shared some strategy.
Like👍 & Retweet🔄for wider reach and for more such learning thread in the future.
1/22
Most of us would confuse it with Relative Strength Index (RSI) but Relative Strength is a different indicator.
We have already covered about "Uses of RSI" in below thread👇
https://t.co/oTOrW7joNI
One can go through this if you haven't.
2/22
#RSI is a common indicator which most of us use in the stock market.
— Yash Mehta (@YMehta_) October 22, 2021
This learning thread would be on
"\U0001d650\U0001d668\U0001d65a\U0001d668 \U0001d664\U0001d65b \U0001d64d\U0001d64e\U0001d644"
Like\U0001f44d & Retweet\U0001f504 for wider reach and for more such learning thread in the future.
Also, an investment strategy is shared using RSI in the end.
1/16
Now coming to Relative Strength (RS).
It is basically a strategy used in momentum investing which shows strength or weakness between two asset classes (two stocks, index, commodity).
One can read about this in below
As of now, I am using this indicator on .@tradingview platform.
It's free and one can add it in their Tradingview account as well, using this link👇
https://t.co/FxCjJFsNOG
There are multiple variants in this as well. Some traders use multiple time frame RS.
4/22
RS basically compares returns of one stock/index with the returns of benchmark stock/index at a particular time horizon.
Let's say, I want to analyze TCS and Benchmark Index is Nifty.
5/22
You May Also Like

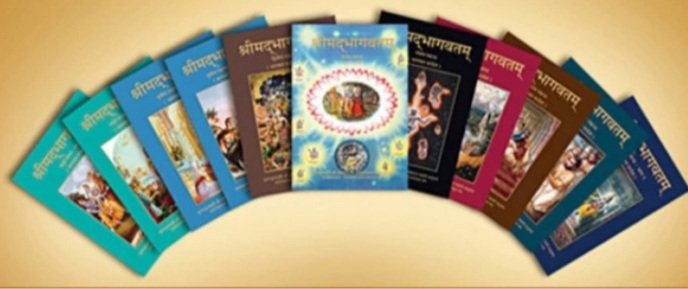
It was Ved Vyas who edited the eighteen thousand shlokas of Bhagwat. This book destroys all your sins. It has twelve parts which are like kalpvraksh.
In the first skandh, the importance of Vedvyas
and characters of Pandavas are described by the dialogues between Suutji and Shaunakji. Then there is the story of Parikshit.
Next there is a Brahm Narad dialogue describing the avtaar of Bhagwan. Then the characteristics of Puraan are mentioned.
It also discusses the evolution of universe.( https://t.co/2aK1AZSC79 )
Next is the portrayal of Vidur and his dialogue with Maitreyji. Then there is a mention of Creation of universe by Brahma and the preachings of Sankhya by Kapil Muni.
HOW LIFE EVOLVED IN THIS UNIVERSE AS PER OUR SCRIPTURES.
— Anshul Pandey (@Anshulspiritual) August 29, 2020
Well maximum of Living being are the Vansaj of Rishi Kashyap. I have tried to give stories from different-different Puran. So lets start.... pic.twitter.com/MrrTS4xORk
In the next section we find the portrayal of Sati, Dhruv, Pruthu, and the story of ancient King, Bahirshi.
In the next section we find the character of King Priyavrat and his sons, different types of loks in this universe, and description of Narak. ( https://t.co/gmDTkLktKS )
Thread on NARK(HELL) / \u0928\u0930\u094d\u0915
— Anshul Pandey (@Anshulspiritual) August 11, 2020
Well today i will take you to a journey where nobody wants to go i.e Nark. Hence beware of doing Adharma/Evil things. There are various mentions in Puranas about Nark, But my Thread is only as per Bhagwat puran(SS attached in below Thread)
1/8 pic.twitter.com/raHYWtB53Q
In the sixth part we find the portrayal of Ajaamil ( https://t.co/LdVSSNspa2 ), Daksh and the birth of Marudgans( https://t.co/tecNidVckj )
In the seventh section we find the story of Prahlad and the description of Varnashram dharma. This section is based on karma vaasna.
#THREAD
— Anshul Pandey (@Anshulspiritual) August 12, 2020
WHY PARENTS CHOOSE RELIGIOUS OR PARAMATMA'S NAMES FOR THEIR CHILDREN AND WHICH ARE THE EASIEST WAY TO WASH AWAY YOUR SINS.
Yesterday I had described the types of Naraka's and the Sin or Adharma for a person to be there.
1/8 pic.twitter.com/XjPB2hfnUC


Unfortunately the "This work includes the identification of viral sequences in bat samples, and has resulted in the isolation of three bat SARS-related coronaviruses that are now used as reagents to test therapeutics and vaccines." were BEFORE the

chimeric infectious clone grants were there.https://t.co/DAArwFkz6v is in 2017, Rs4231.
https://t.co/UgXygDjYbW is in 2016, RsSHC014 and RsWIV16.
https://t.co/krO69CsJ94 is in 2013, RsWIV1. notice that this is before the beginning of the project
starting in 2016. Also remember that they told about only 3 isolates/live viruses. RsSHC014 is a live infectious clone that is just as alive as those other "Isolates".
P.D. somehow is able to use funds that he have yet recieved yet, and send results and sequences from late 2019 back in time into 2015,2013 and 2016!
https://t.co/4wC7k1Lh54 Ref 3: Why ALL your pangolin samples were PCR negative? to avoid deep sequencing and accidentally reveal Paguma Larvata and Oryctolagus Cuniculus?