
Lots of good setups in today's screening.
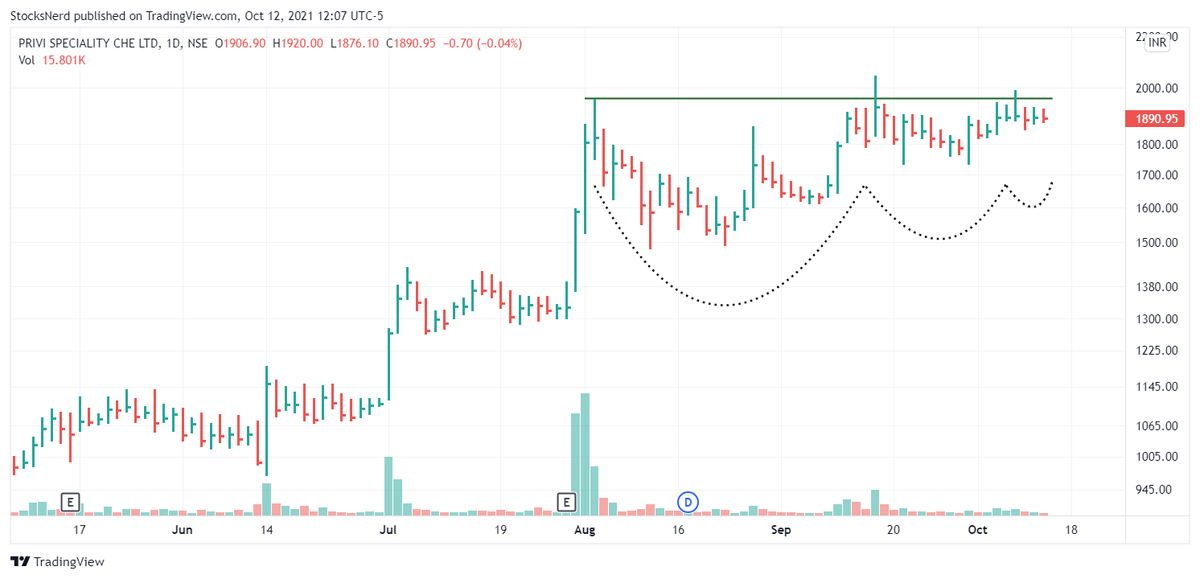
Posting here the chart of #PRIVISCL looks very good.
Others are-
#MAHLOG
#ACE
#TDPOWERSYS
More from Ravi Sharma
It's a secret recipe 😋
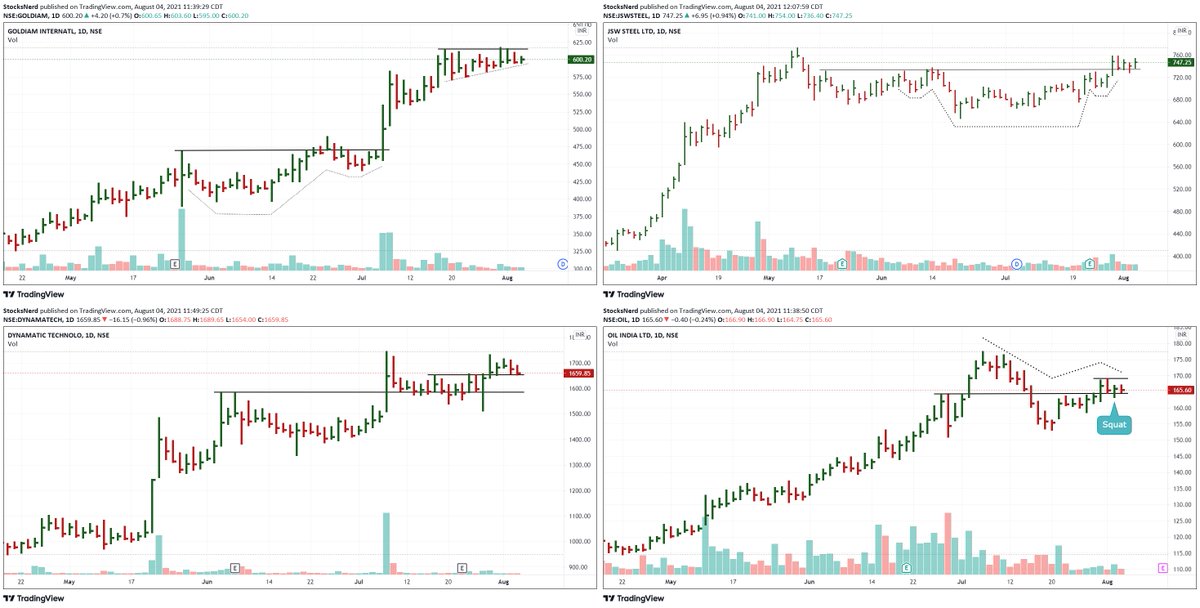
But I can give you some pointers-
1) Choose stocks in Stage 2 with RS > 75
2) Identify these setups - Cup with Handle, High Tight Flag, Rectangle, VCP, Squat, Low Cheat, 3-C.
2) Wait for the significant contraction in daily range, volatility & Volume.
But I can give you some pointers-
1) Choose stocks in Stage 2 with RS > 75
2) Identify these setups - Cup with Handle, High Tight Flag, Rectangle, VCP, Squat, Low Cheat, 3-C.
2) Wait for the significant contraction in daily range, volatility & Volume.
How do u screen stocks???
— \u2206bhishek Jain (@AbhishekTMM) August 6, 2021
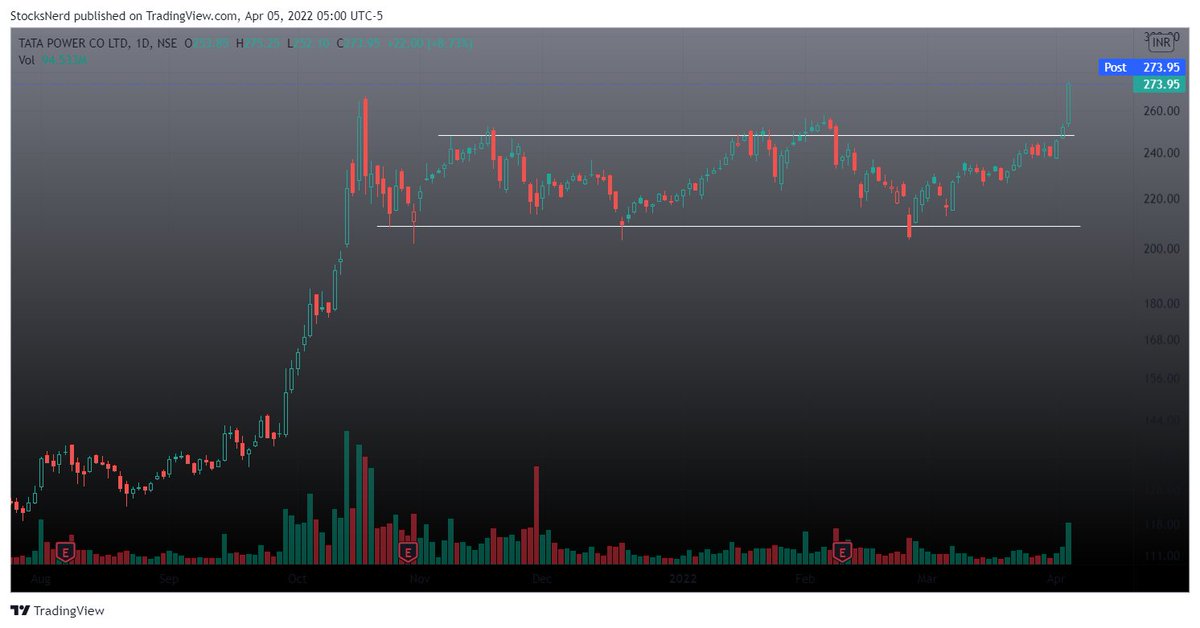
Excellent move in #TATAPOWER today.
Signs are all over the place, you just needed to read them. https://t.co/17bwpa1psj
Signs are all over the place, you just needed to read them. https://t.co/17bwpa1psj
#TATAPOWER is consolidating nicely around 50 & 10-DMA.
— Ravi Sharma (@StocksNerd) April 1, 2022
3 Pocket Pivot days in the last couple of weeks are signaling the interest of buyers.
4 months long base.
Steady growth in Earnings & Sales in the last 3 quarters.
Relative Strength: 77
Group Rank: 22 pic.twitter.com/2WFeUGiV1z
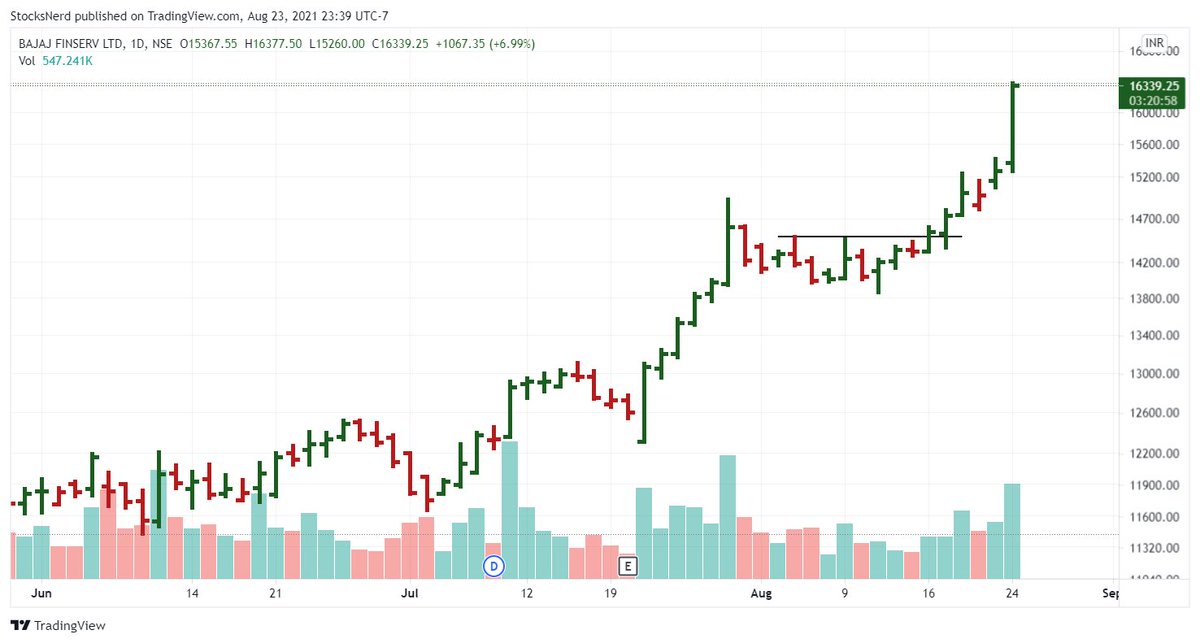
Reason and pre-analysis for #BAJAJFINSV before buy-
While buying breakouts, your odds will improve a lot when you prefer the following:
1. Strong Relative Strength.
2. Tight price range on low Volume and a pattern which is easy on eyes. https://t.co/CprKpAfgtj
While buying breakouts, your odds will improve a lot when you prefer the following:
1. Strong Relative Strength.
2. Tight price range on low Volume and a pattern which is easy on eyes. https://t.co/CprKpAfgtj
#BAJAJFINSV
— Ravi Sharma (@StocksNerd) August 14, 2021
Setting up in a tight base. Volume has been drying up.
Waiting for the breakout. pic.twitter.com/KWoGZAwkLO
You May Also Like










THREAD: 12 Things Everyone Should Know About IQ
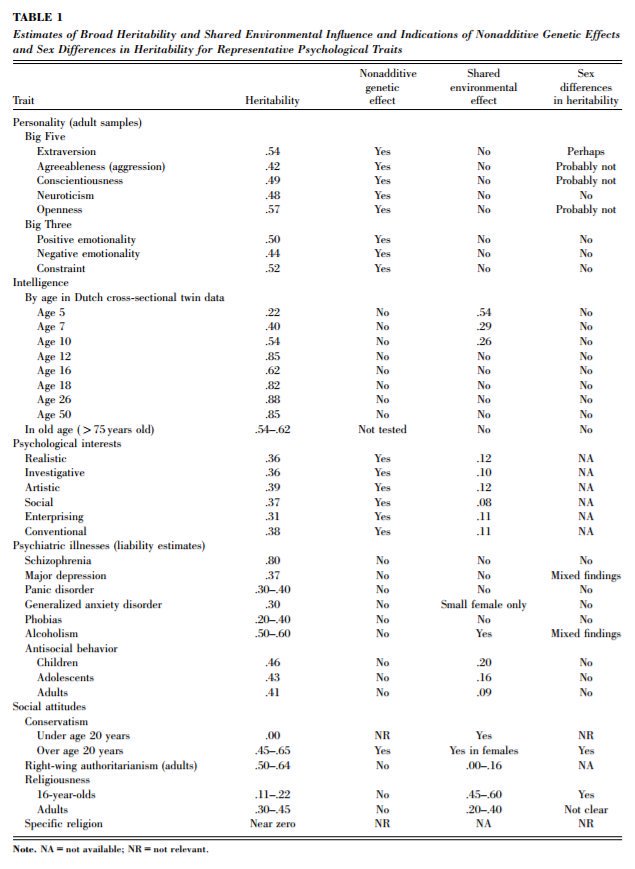
1. IQ is one of the most heritable psychological traits – that is, individual differences in IQ are strongly associated with individual differences in genes (at least in fairly typical modern environments). https://t.co/3XxzW9bxLE
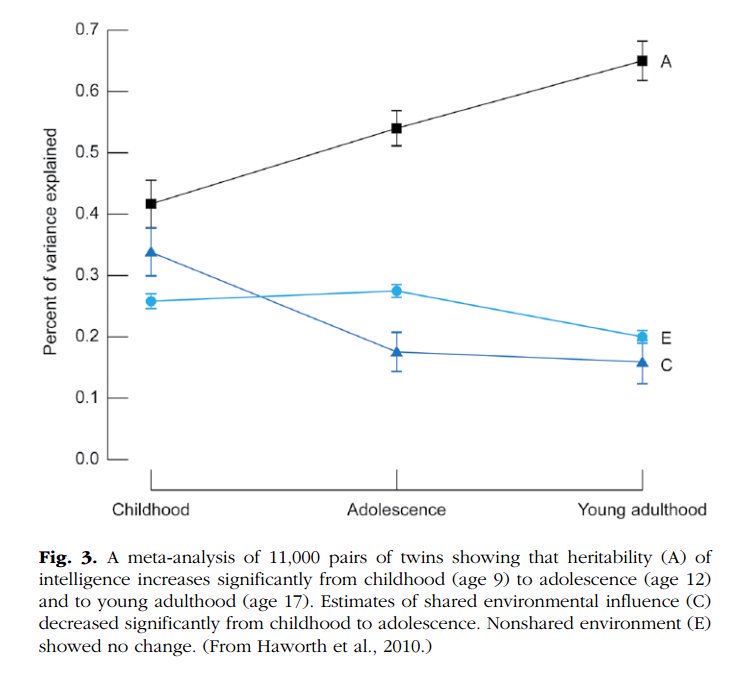
2. The heritability of IQ *increases* from childhood to adulthood. Meanwhile, the effect of the shared environment largely fades away. In other words, when it comes to IQ, nature becomes more important as we get older, nurture less. https://t.co/UqtS1lpw3n
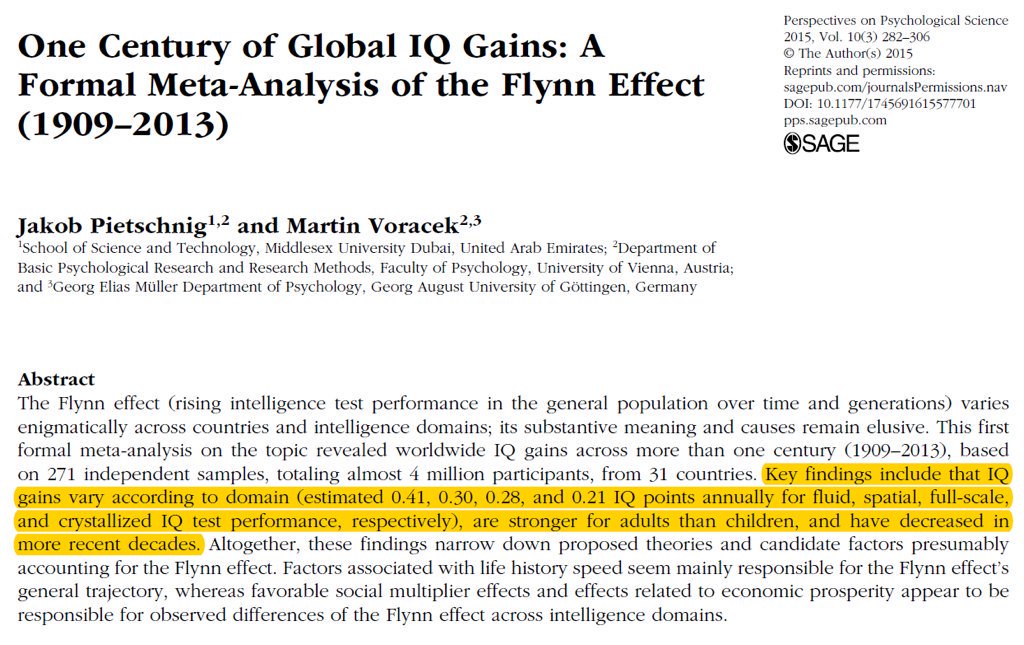
3. IQ scores have been increasing for the last century or so, a phenomenon known as the Flynn effect. https://t.co/sCZvCst3hw (N ≈ 4 million)
(Note that the Flynn effect shows that IQ isn't 100% genetic; it doesn't show that it's 100% environmental.)
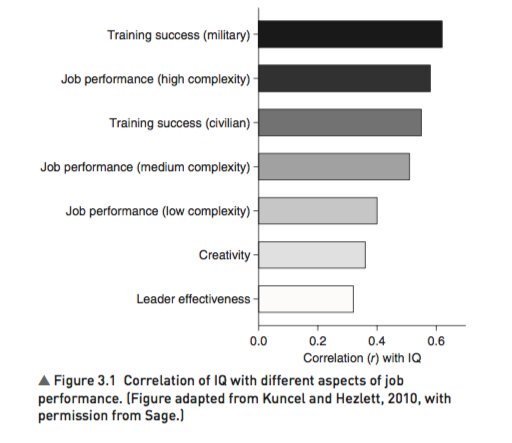
4. IQ predicts many important real world outcomes.
For example, though far from perfect, IQ is the single-best predictor of job performance we have – much better than Emotional Intelligence, the Big Five, Grit, etc. https://t.co/rKUgKDAAVx https://t.co/DWbVI8QSU3
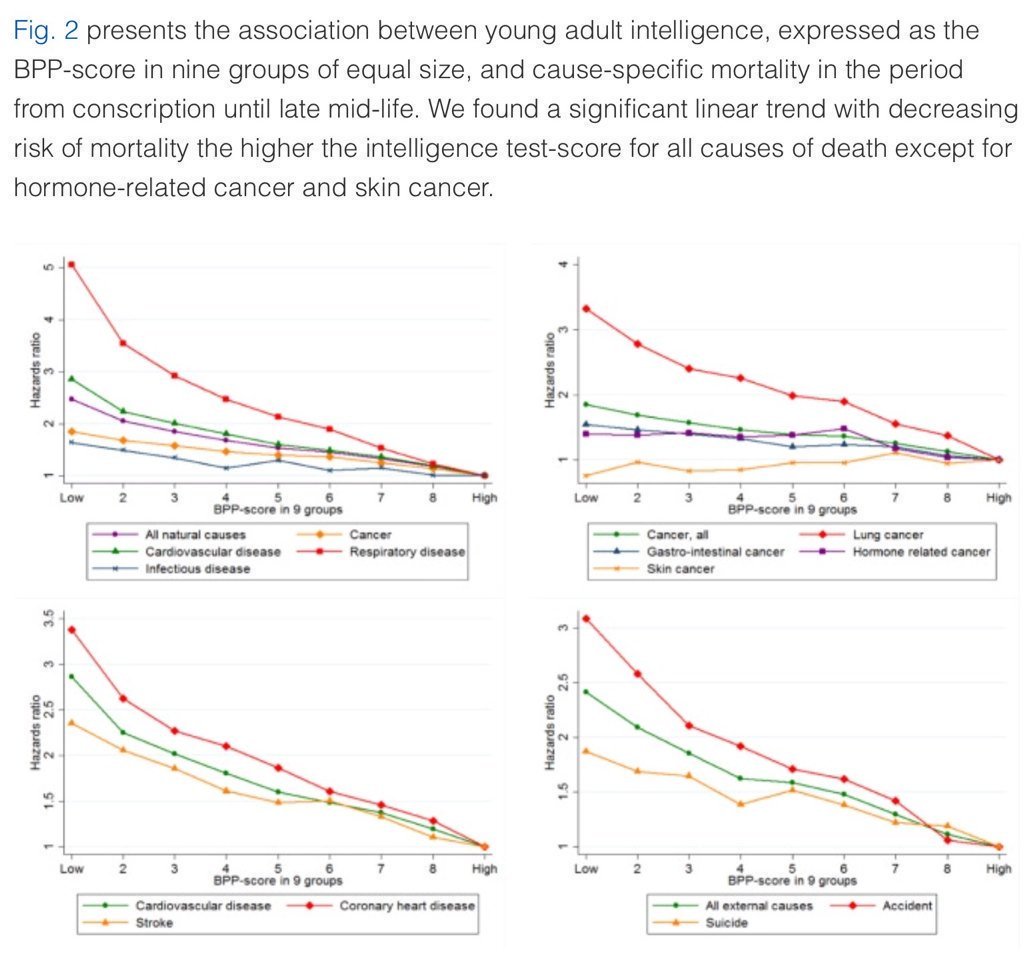
5. Higher IQ is associated with a lower risk of death from most causes, including cardiovascular disease, respiratory disease, most forms of cancer, homicide, suicide, and accident. https://t.co/PJjGNyeQRA (N = 728,160)
1. IQ is one of the most heritable psychological traits – that is, individual differences in IQ are strongly associated with individual differences in genes (at least in fairly typical modern environments). https://t.co/3XxzW9bxLE
2. The heritability of IQ *increases* from childhood to adulthood. Meanwhile, the effect of the shared environment largely fades away. In other words, when it comes to IQ, nature becomes more important as we get older, nurture less. https://t.co/UqtS1lpw3n
3. IQ scores have been increasing for the last century or so, a phenomenon known as the Flynn effect. https://t.co/sCZvCst3hw (N ≈ 4 million)
(Note that the Flynn effect shows that IQ isn't 100% genetic; it doesn't show that it's 100% environmental.)
4. IQ predicts many important real world outcomes.
For example, though far from perfect, IQ is the single-best predictor of job performance we have – much better than Emotional Intelligence, the Big Five, Grit, etc. https://t.co/rKUgKDAAVx https://t.co/DWbVI8QSU3
5. Higher IQ is associated with a lower risk of death from most causes, including cardiovascular disease, respiratory disease, most forms of cancer, homicide, suicide, and accident. https://t.co/PJjGNyeQRA (N = 728,160)

