Hello folks, Today I got a map of the Milwaukee Metropolitan area. We are going to be looking at Scott Walker's 3rd and 4th Election.

More from Politics


So let's see a show of hands: how many of you even knew Huber was digging into the Clinton Foundation? While he was assisting Horowitz in his digging into the FISC/Steele Dossier/Fusion GPS/Perkins Coie/DNC/Hillary campaign stuff?
I'm sure Huber is coming to DC *only* to discuss Clinton Foundation things with Meadows and his committee.
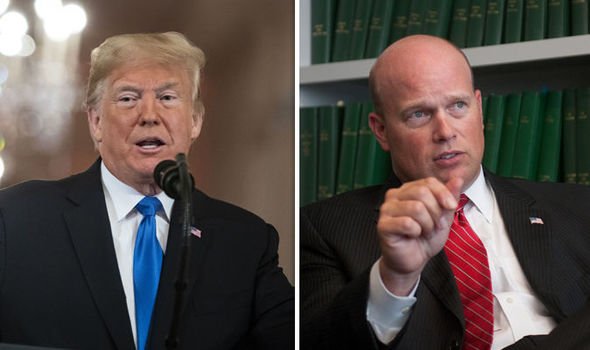
He for certain, like, won't be huddling with Horowitz or that new guy, Whitaker while he's in town. That would NEVER HAPPEN. [wink wink wink!] 😉
I just spent a year and a half telling you they will SHOW YOU what they are REALLY DOING when they are READY.
Not before.
No matter how much whining is done about it.
I'm exhausted but it's worth it.
Now you know why they're f**king TERRIFIED of Whitaker, the closer tapped by Trump to come in late for the hysterical fireworks that will ensue soon.
Look who's suddenly fund raising for his legal defen- er, I mean, ha ha - his reelection campaign!
Breaking News: House GOP to hold investigative hearing into DOJ\u2019s handling of Clinton Foundation probe. Top prosecutor to be summoned. https://t.co/HogyXHHcvo
— John Solomon (@jsolomonReports) November 21, 2018
I'm sure Huber is coming to DC *only* to discuss Clinton Foundation things with Meadows and his committee.
He for certain, like, won't be huddling with Horowitz or that new guy, Whitaker while he's in town. That would NEVER HAPPEN. [wink wink wink!] 😉
I just spent a year and a half telling you they will SHOW YOU what they are REALLY DOING when they are READY.
Not before.
No matter how much whining is done about it.
I'm exhausted but it's worth it.
Now you know why they're f**king TERRIFIED of Whitaker, the closer tapped by Trump to come in late for the hysterical fireworks that will ensue soon.
Look who's suddenly fund raising for his legal defen- er, I mean, ha ha - his reelection campaign!
President Trump just attacked Adam on Twitter with his most profane insult yet. Will you chip in $5 to send Trump a message and show him you stand with Adam?
— Adam Schiff (@AdamSchiff) November 19, 2018



You May Also Like

Keep dwelling on this:
Further Examination of the Motif near PRRA Reveals Close Structural Similarity to the SEB Superantigen as well as Sequence Similarities to Neurotoxins and a Viral SAg.
The insertion PRRA together with 7 sequentially preceding residues & succeeding R685 (conserved in β-CoVs) form a motif, Y674QTQTNSPRRAR685, homologous to those of neurotoxins from Ophiophagus (cobra) and Bungarus genera, as well as neurotoxin-like regions from three RABV strains
(20) (Fig. 2D). We further noticed that the same segment bears close similarity to the HIV-1 glycoprotein gp120 SAg motif F164 to V174.
https://t.co/EwwJOSa8RK
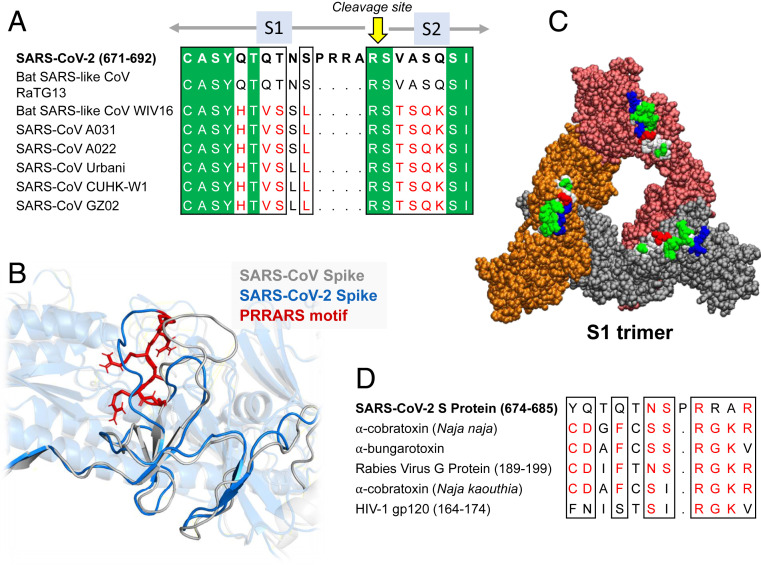
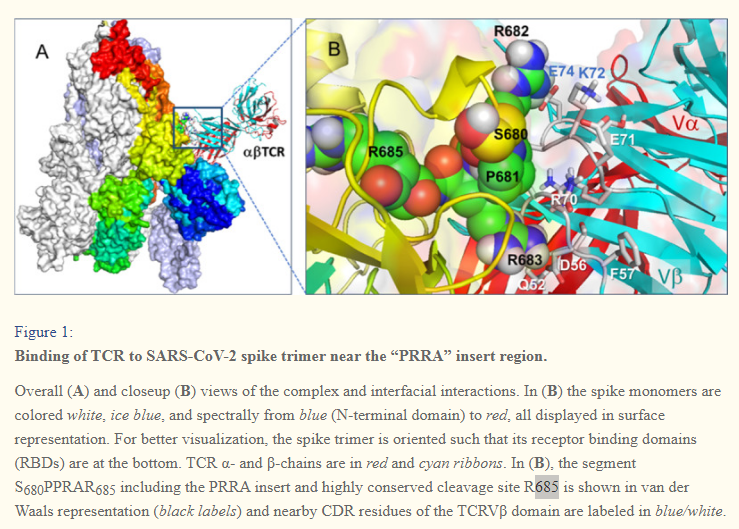
In (B), the segment S680PPRAR685 including the PRRA insert and highly conserved cleavage site *R685* is shown in van der Waals representation (black labels) and nearby CDR residues of the TCRVβ domain are labeled in blue/white
https://t.co/BsY8BAIzDa
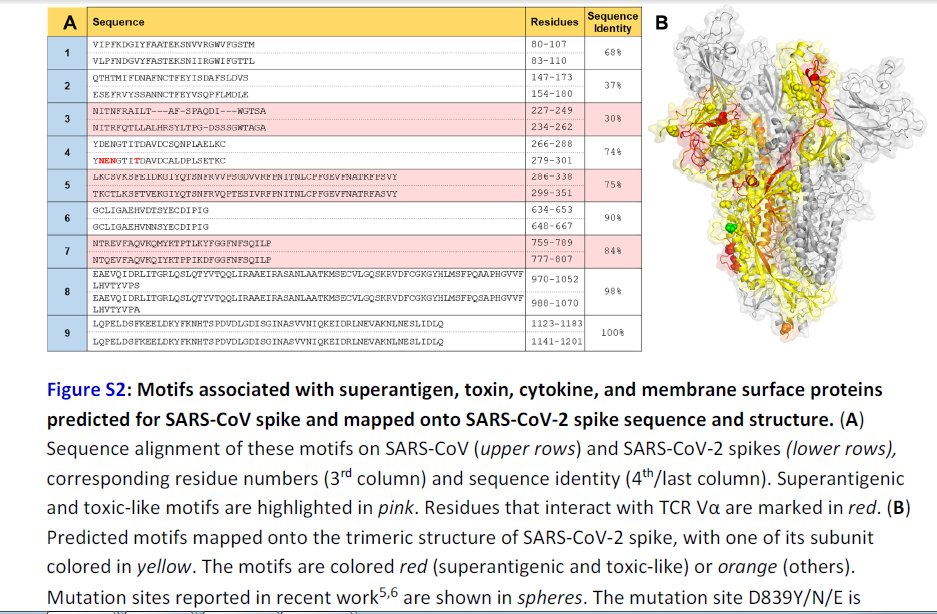
Sequence Identity %
https://t.co/BsY8BAIzDa
Y674 - QTQTNSPRRA - R685
Similar to neurotoxins from Ophiophagus (cobra) & Bungarus genera & neurotoxin-like regions from three RABV strains
T678 - NSPRRA- R685
Superantigenic core, consistently aligned against bacterial or viral SAgs
Further Examination of the Motif near PRRA Reveals Close Structural Similarity to the SEB Superantigen as well as Sequence Similarities to Neurotoxins and a Viral SAg.
The insertion PRRA together with 7 sequentially preceding residues & succeeding R685 (conserved in β-CoVs) form a motif, Y674QTQTNSPRRAR685, homologous to those of neurotoxins from Ophiophagus (cobra) and Bungarus genera, as well as neurotoxin-like regions from three RABV strains
(20) (Fig. 2D). We further noticed that the same segment bears close similarity to the HIV-1 glycoprotein gp120 SAg motif F164 to V174.
https://t.co/EwwJOSa8RK
In (B), the segment S680PPRAR685 including the PRRA insert and highly conserved cleavage site *R685* is shown in van der Waals representation (black labels) and nearby CDR residues of the TCRVβ domain are labeled in blue/white
https://t.co/BsY8BAIzDa
Sequence Identity %
https://t.co/BsY8BAIzDa
Y674 - QTQTNSPRRA - R685
Similar to neurotoxins from Ophiophagus (cobra) & Bungarus genera & neurotoxin-like regions from three RABV strains
T678 - NSPRRA- R685
Superantigenic core, consistently aligned against bacterial or viral SAgs