
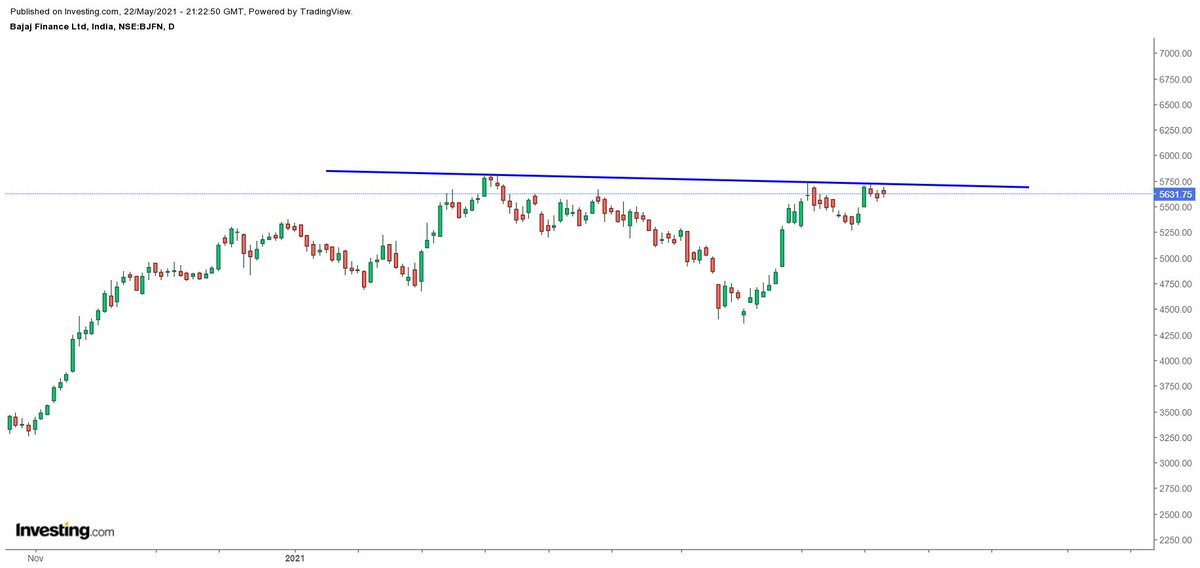
#Nifty
1. 17400 to 18115 (Expected)
2. 18115 to 16825 (Actual)
Its playing out. Need to form bottom to call higher low n start moving up to confirm it. Lets get the reversal sign from 16620-16900 zone which is 200dema,50-61.8% fibo
I see this as higher bottom formation process

More from Shivaji Vitthalrao🇮🇳
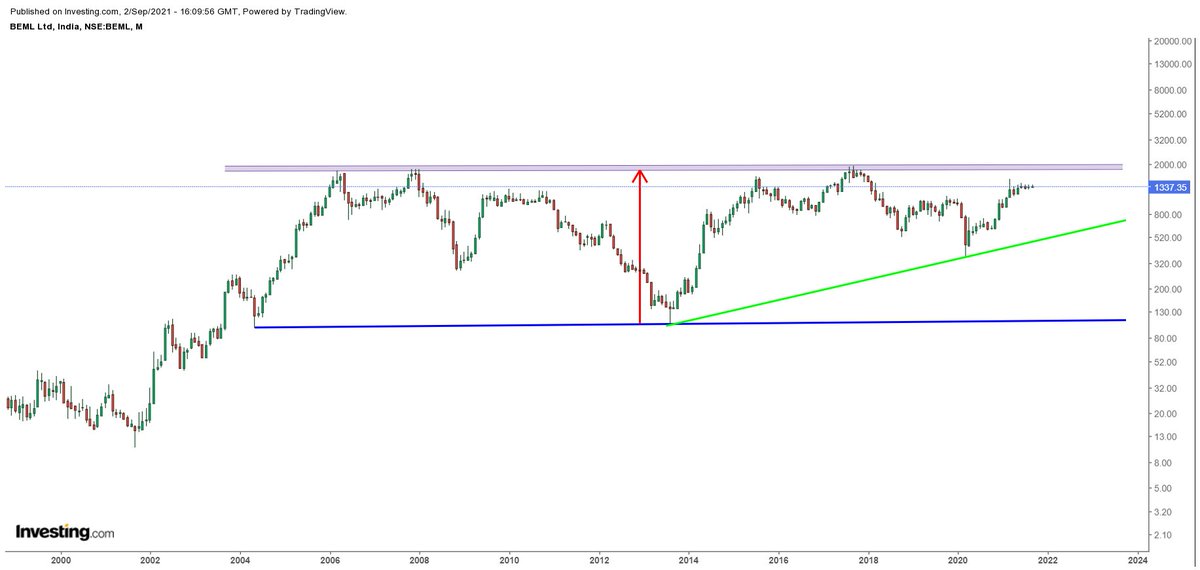
BEML
1. Stock is consolidating in the band 100-120 on lower side & 1900-1950 on upper side.
2. CMP 1344 1st targets 1850-1950
3. Medium term targets 2400-2500
4. Long term taregts 3500 first and then 8,000-10,000 in next 4-5 yrs
5. This is going to be 15-16 years breakout https://t.co/BXMv5GjsGW
6. Stock hits high 160-175 in 1995 & 1997
7. went into down trend, consolidated for 3 yrs 1999-2002
8. Gave breakout above 34 hinting at major shift in Feb 2002
9. Gave 1st multi year breakout in Oct 2003 above 160-175 which was failed
10. Next attempt in Sep 2004 crossed 175
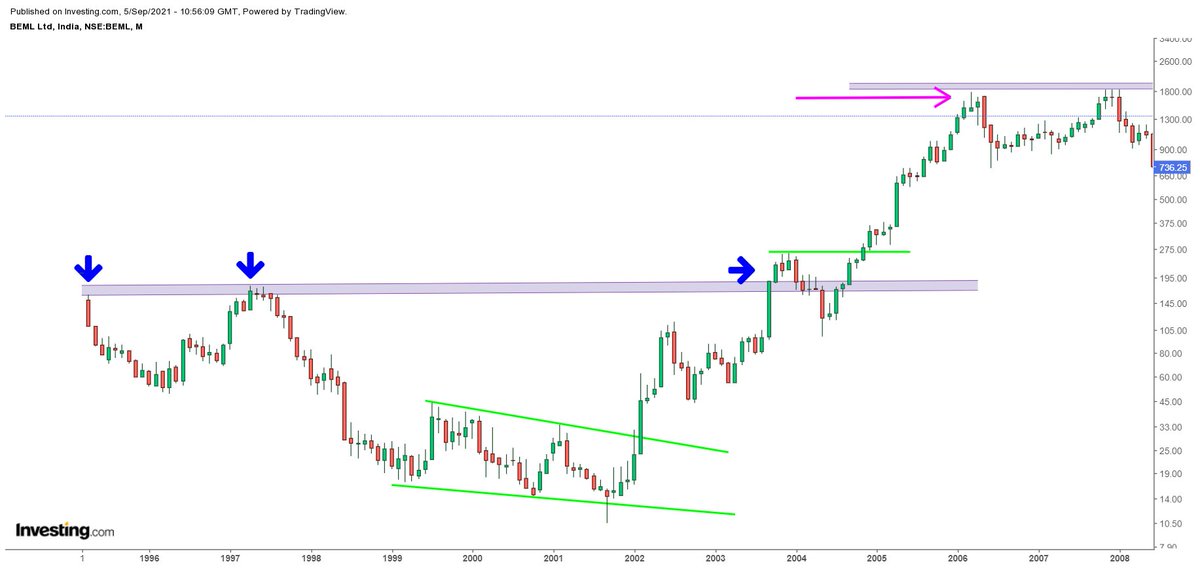
11. Above 1995-1997 highs (160-175) stock went on to become 10x in a matter of 20-22 months
12. CMP 1344 Multi year breakout will trigger above 1950 on weekly closing basis
13. Will be watching 1st breakout above 1950
14. SL 1260/1100 depends on risk of the trader or investor
1. Stock is consolidating in the band 100-120 on lower side & 1900-1950 on upper side.
2. CMP 1344 1st targets 1850-1950
3. Medium term targets 2400-2500
4. Long term taregts 3500 first and then 8,000-10,000 in next 4-5 yrs
5. This is going to be 15-16 years breakout https://t.co/BXMv5GjsGW
Spotted a stock which can become 5digits and 5x over 3-5 years
— Shivaji Vitthalrao\U0001f1ee\U0001f1f3 (@shivaji_1983) September 2, 2021
Headquarters in Namma Bengaluru, Karnataka.
Keep Thinking will post over weekend\U0001f92a
6. Stock hits high 160-175 in 1995 & 1997
7. went into down trend, consolidated for 3 yrs 1999-2002
8. Gave breakout above 34 hinting at major shift in Feb 2002
9. Gave 1st multi year breakout in Oct 2003 above 160-175 which was failed
10. Next attempt in Sep 2004 crossed 175
11. Above 1995-1997 highs (160-175) stock went on to become 10x in a matter of 20-22 months
12. CMP 1344 Multi year breakout will trigger above 1950 on weekly closing basis
13. Will be watching 1st breakout above 1950
14. SL 1260/1100 depends on risk of the trader or investor
More from Nifty


#Nifty
So now that Nifty has undergone ABC correction in the expected manner, what to expect next?
I think we have started larger degree wave 3, once 16800 was crossed.
16800 is the reference level now. We will get more sense by end of next week/ month. https://t.co/KsziuUpZxU
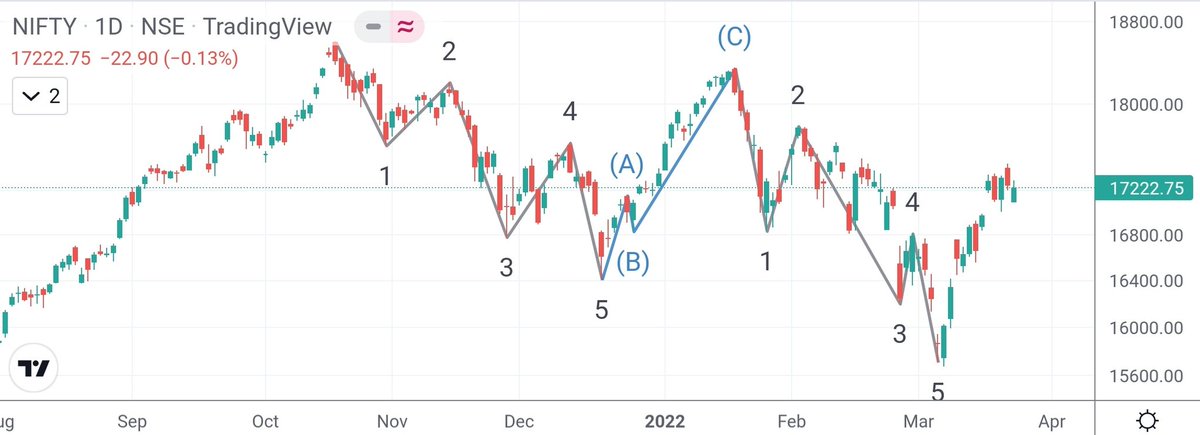
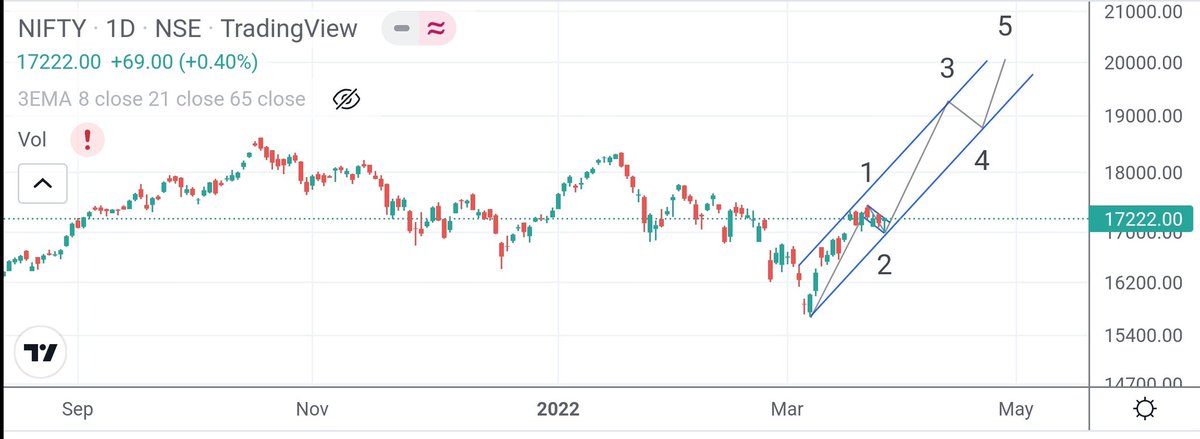
#NIFTY
If 17445 is taken out, then may be we are heading to fresh new all time on Nifty.
Things may pan out way faster than expected.
#NIFTY
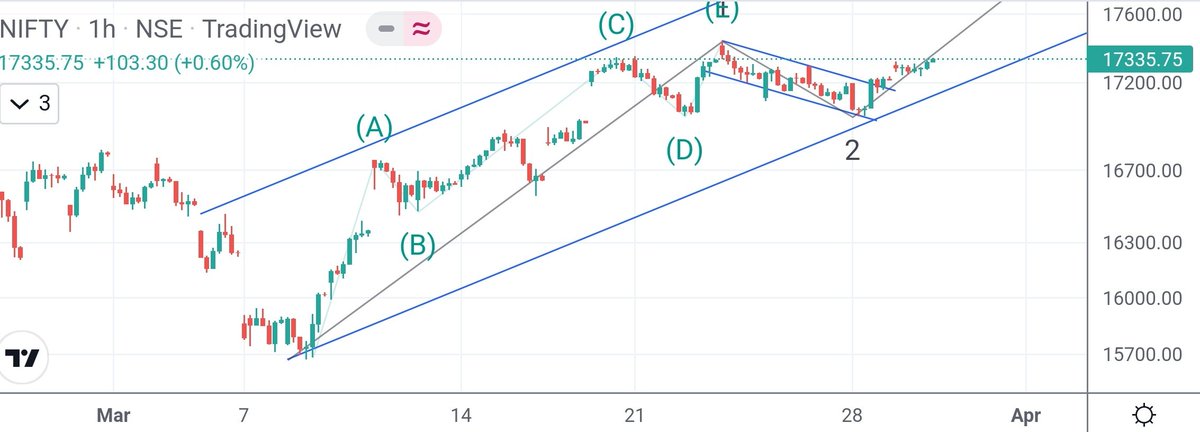
Zoomed in cross-section of the chart above.
Wave 3 of 1 should have started today, which can take Nifty to fresh all time highs.
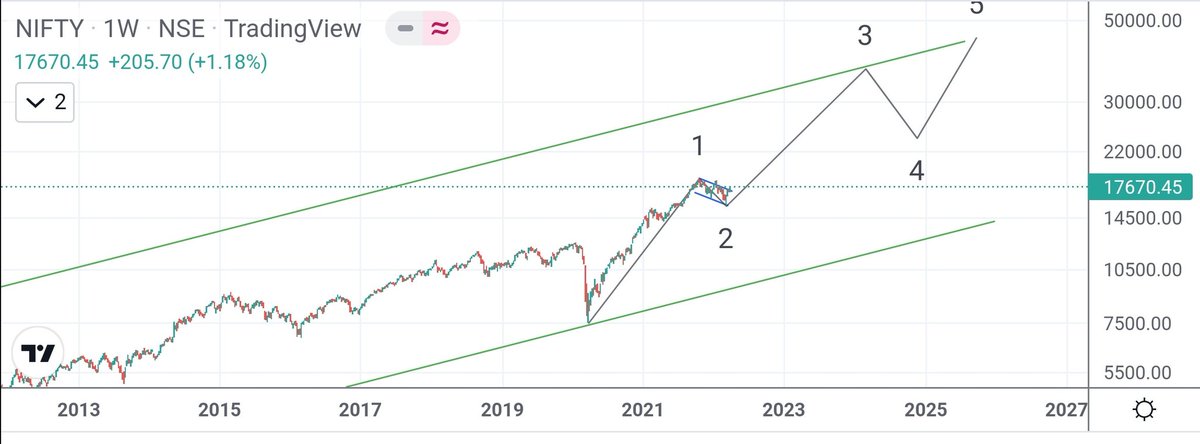
#NIFTY
So now Nifty is moving more clearly on the expected path, what's next?
Nifty has started longer term wave 3 advancement, pending final confirmation of HH by crossing 17800.
In Wave 1 of 3, can expect a move to 20k+.
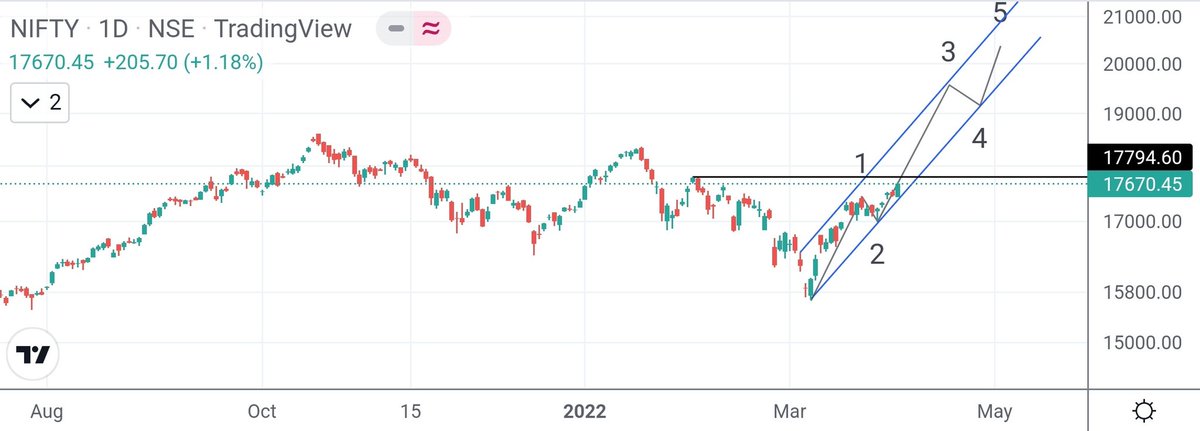
In terms of longer term wave structure:
Wave 1: 7500 to 18600
Wave 3: 15700 to 35000+
And this can pan out over next 2 years or so.
Since wave 2 was a shallow correction, wave 4 can potentially be a deeper correction.
So now that Nifty has undergone ABC correction in the expected manner, what to expect next?
I think we have started larger degree wave 3, once 16800 was crossed.
16800 is the reference level now. We will get more sense by end of next week/ month. https://t.co/KsziuUpZxU
I am no expert in Wave Theory, but can this be a possible path over next few weeks/months?
— Mayank Narula (@Mayank_Narula1) December 6, 2021
Views requested. @idineshptl @indiacharts @nishkumar1977 pic.twitter.com/u3DjEeqoqB
#NIFTY
If 17445 is taken out, then may be we are heading to fresh new all time on Nifty.
Things may pan out way faster than expected.
#NIFTY
Zoomed in cross-section of the chart above.
Wave 3 of 1 should have started today, which can take Nifty to fresh all time highs.
#NIFTY
So now Nifty is moving more clearly on the expected path, what's next?
Nifty has started longer term wave 3 advancement, pending final confirmation of HH by crossing 17800.
In Wave 1 of 3, can expect a move to 20k+.
In terms of longer term wave structure:
Wave 1: 7500 to 18600
Wave 3: 15700 to 35000+
And this can pan out over next 2 years or so.
Since wave 2 was a shallow correction, wave 4 can potentially be a deeper correction.


You May Also Like


So friends here is the thread on the recommended pathway for new entrants in the stock market.
Here I will share what I believe are essentials for anybody who is interested in stock markets and the resources to learn them, its from my experience and by no means exhaustive..
First the very basic : The Dow theory, Everybody must have basic understanding of it and must learn to observe High Highs, Higher Lows, Lower Highs and Lowers lows on charts and their
Even those who are more inclined towards fundamental side can also benefit from Dow theory, as it can hint start & end of Bull/Bear runs thereby indication entry and exits.

Next basic is Wyckoff's Theory. It tells how accumulation and distribution happens with regularity and how the market actually
Dow theory is old but
Here I will share what I believe are essentials for anybody who is interested in stock markets and the resources to learn them, its from my experience and by no means exhaustive..
First the very basic : The Dow theory, Everybody must have basic understanding of it and must learn to observe High Highs, Higher Lows, Lower Highs and Lowers lows on charts and their
Even those who are more inclined towards fundamental side can also benefit from Dow theory, as it can hint start & end of Bull/Bear runs thereby indication entry and exits.
Next basic is Wyckoff's Theory. It tells how accumulation and distribution happens with regularity and how the market actually
Dow theory is old but
Old is Gold....
— Professor (@DillikiBiili) January 23, 2020
this Bharti Airtel chart is a true copy of the Wyckoff Pattern propounded in 1931....... pic.twitter.com/tQ1PNebq7d