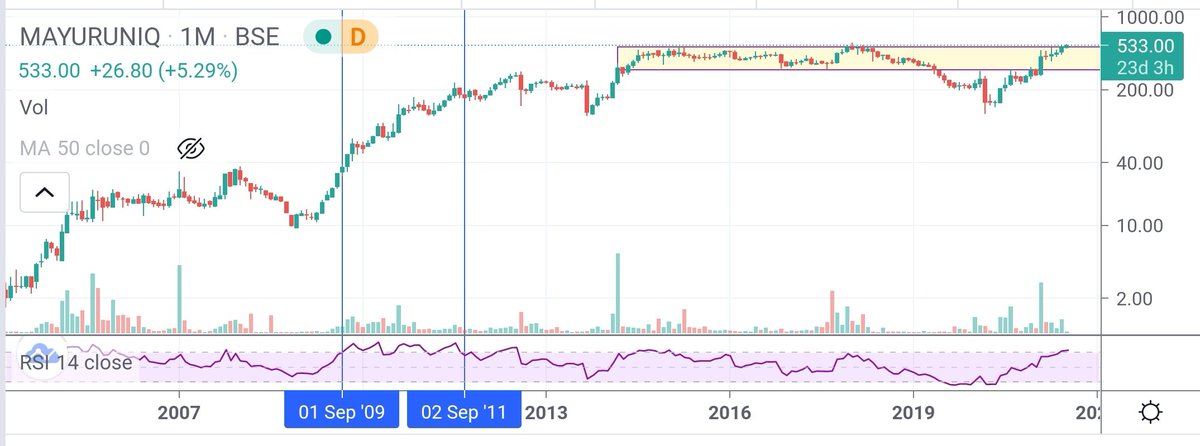
Coming out of 7 years consolidation.
Weekly and monthly RSI crossing over 70.
Can it do what Aarti Drugs and Tata Elxsi did in last 1 year?
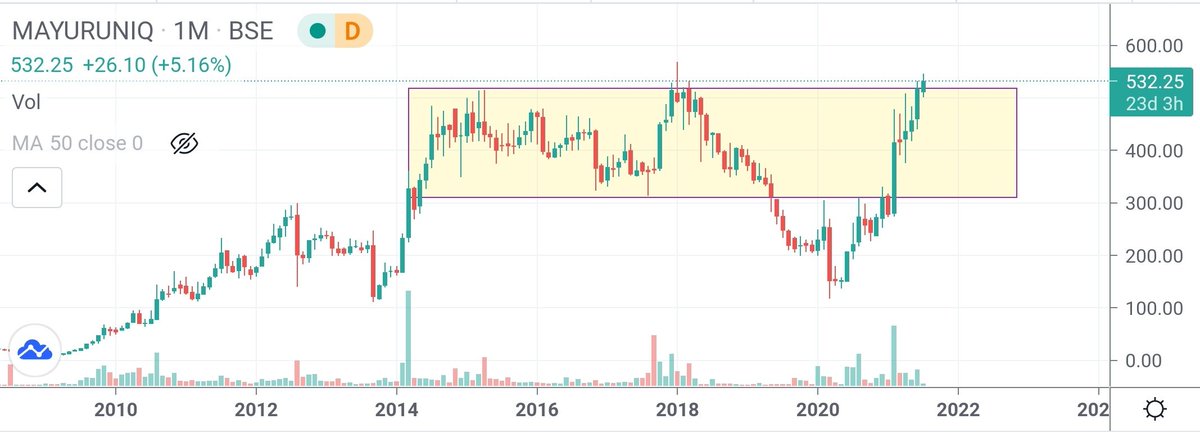
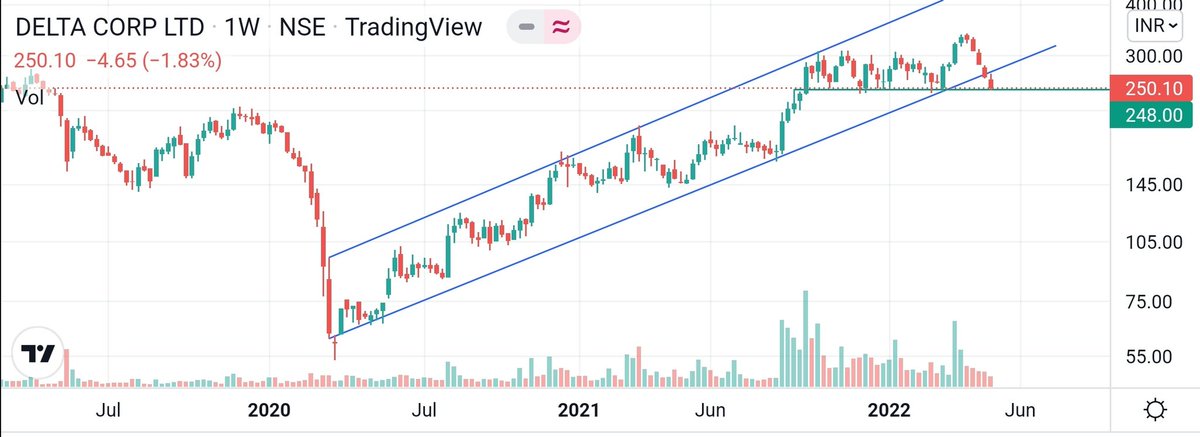
Spot the similarities here in the price action:#AARTIDRUGS
— Mayank Narula (@Mayank_Narula1) October 10, 2020
2013-2015: Monthly RSI goes over 70 and stock goes up 4-5x.
2015-2020: range consolidation
2020: repeat of 2013-15 in few months pic.twitter.com/53L2fNpJoM
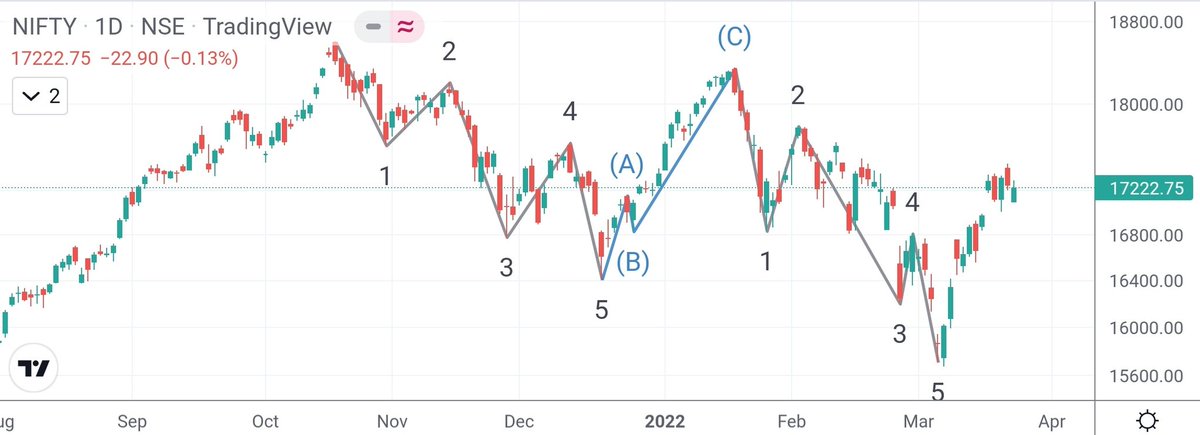
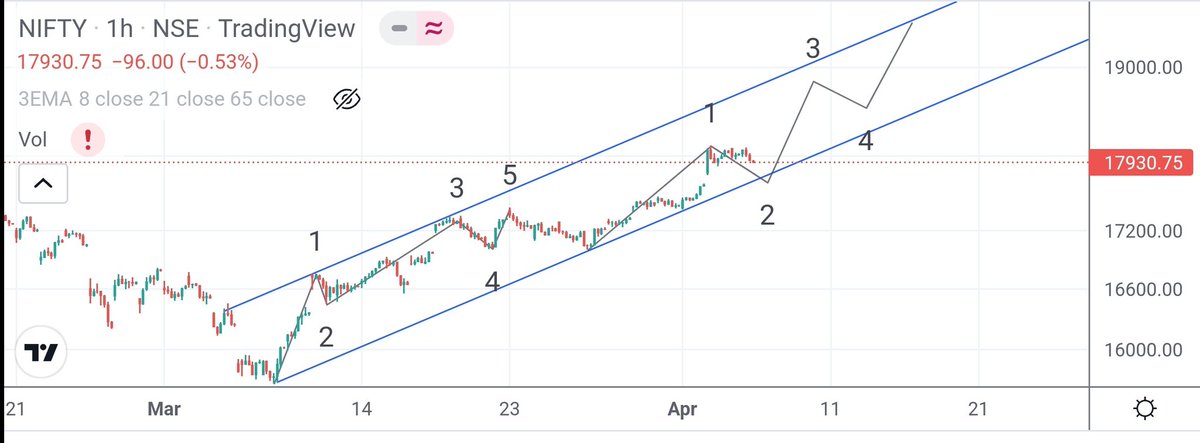
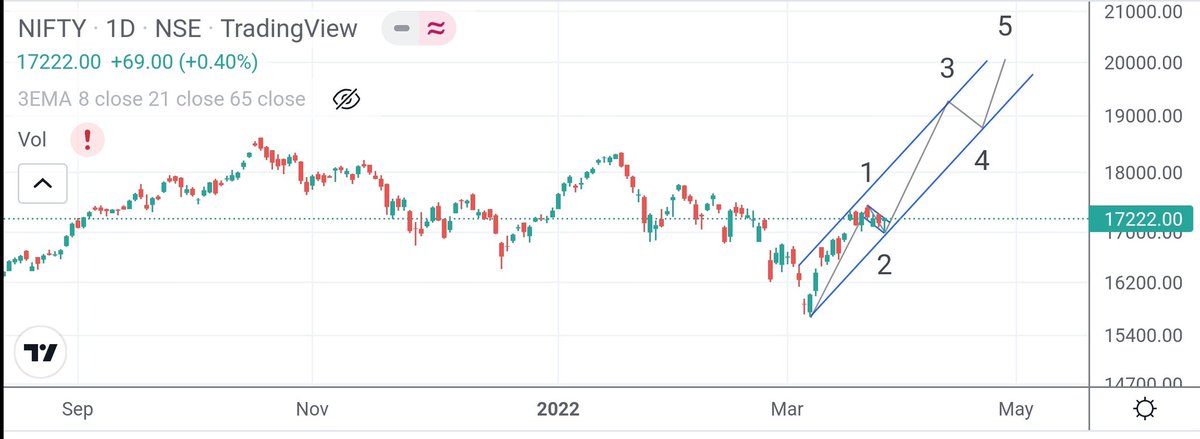
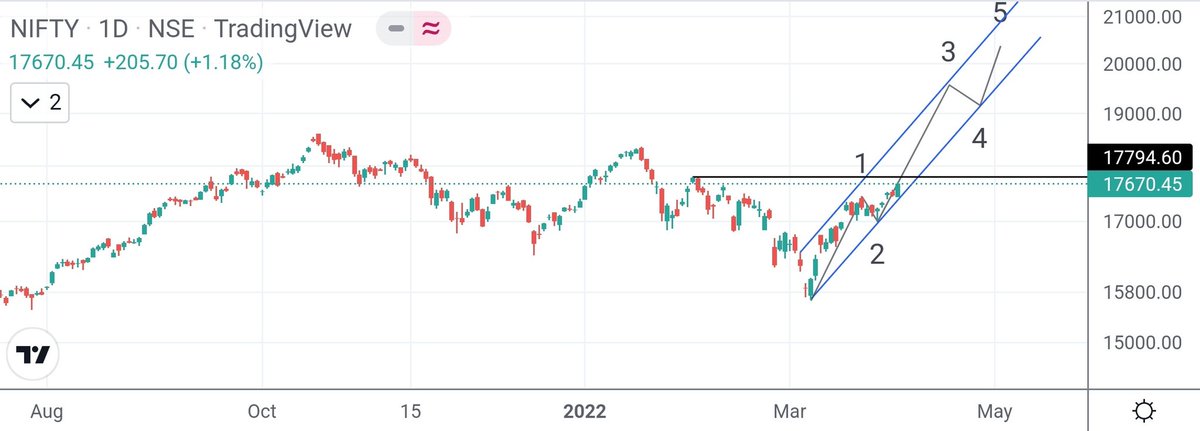
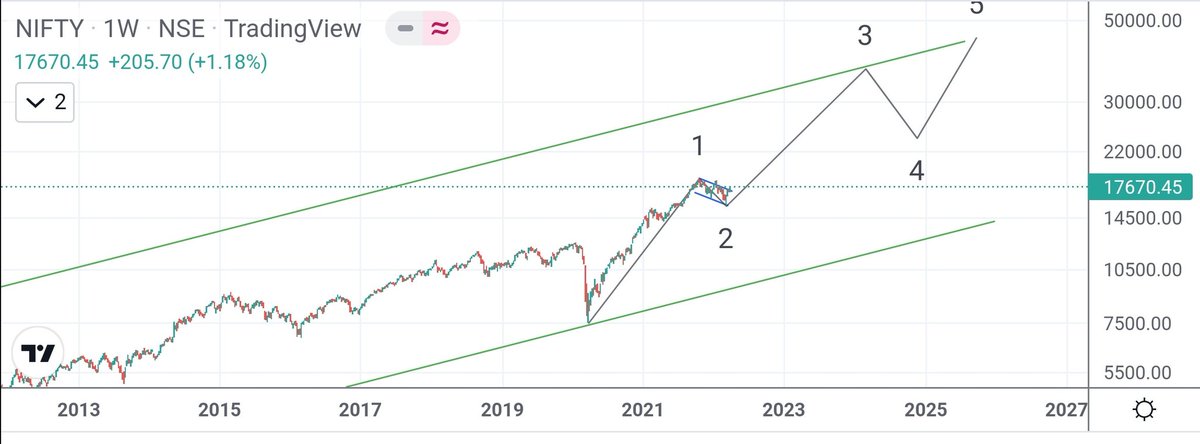
I am no expert in Wave Theory, but can this be a possible path over next few weeks/months?
— Mayank Narula (@Mayank_Narula1) December 6, 2021
Views requested. @idineshptl @indiacharts @nishkumar1977 pic.twitter.com/u3DjEeqoqB

For three years I have wanted to write an article on moral panics. I have collected anecdotes and similarities between today\u2019s moral panic and those of the past - particularly the Satanic Panic of the 80s.
— Ashe Schow (@AsheSchow) September 29, 2018
This is my finished product: https://t.co/otcM1uuUDk