APOLLOPIPE
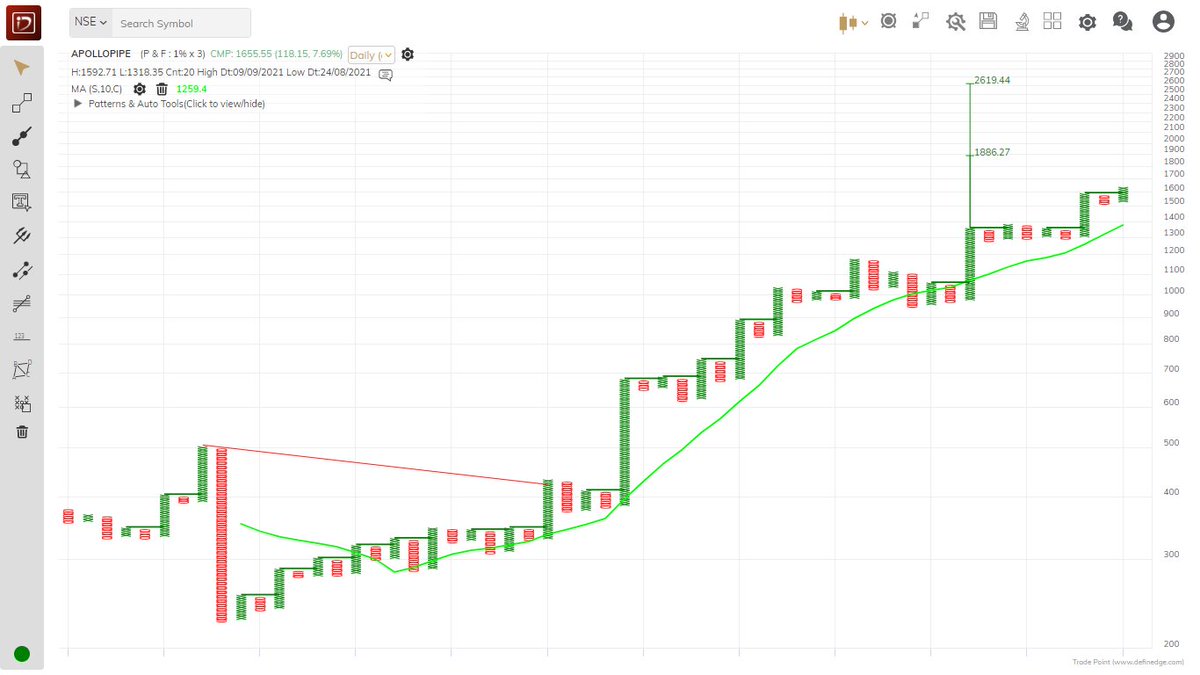
Double Top Buy triggered above 1608.64 daily close on 1% Box Size chart. https://t.co/7jxOpBHGUO
APOLLOPIPE
— Saket Reddy (@saketreddy) July 26, 2021
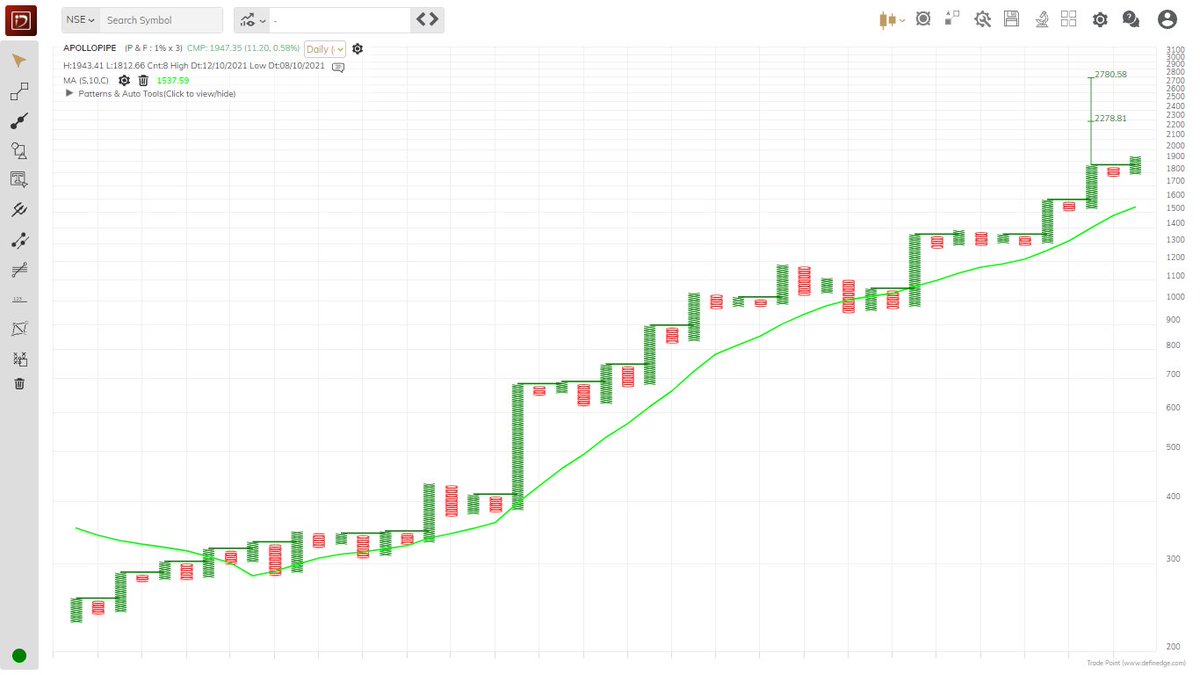
Double Top Buy & T20 Pattern - Bullish above 1204.85 daily close on 3% Box Size chart. pic.twitter.com/009A5IXJeP
More from Saket Reddy

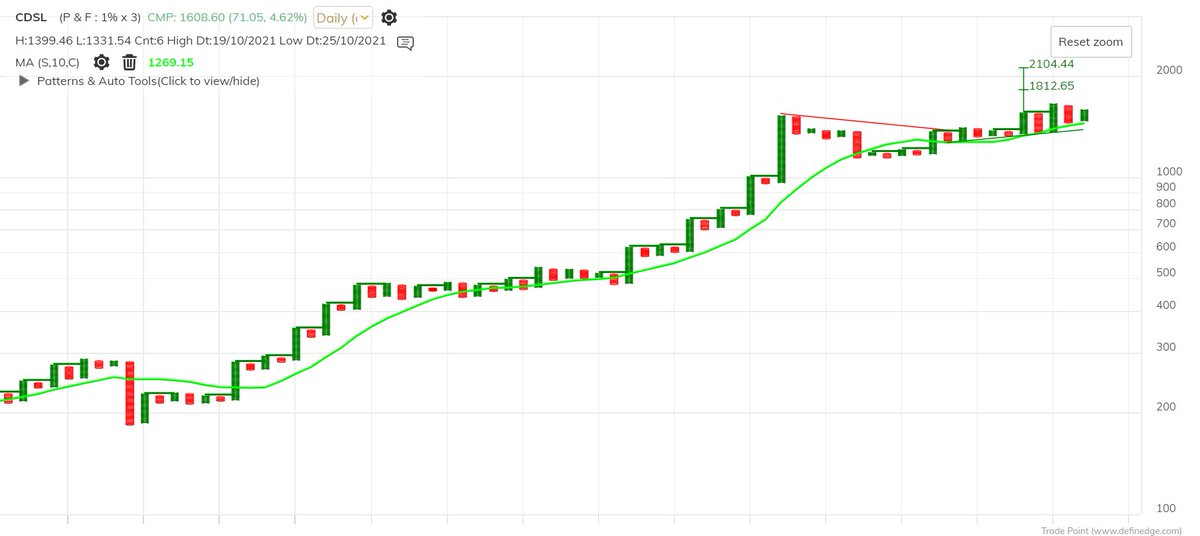
Interesting to see that only Deepak and Pi have grown sales at > 15% for the last 5, 10 and 20 years within these 5 chemical names.
Plotting sales CAGR for few gems in #chemicals, #pharma and #FMCG
— jeevan patwa (@jeevanpatwa) July 14, 2021
Majority has 20Y CAGR > 10Y > 5Y => growth is decelerating as base becomes big...
only outlier being #Deepaknitrate where
20Y CAGR < 10Y < 5Y => accelerating growth... pic.twitter.com/ewpFeKmxQo


More from Aplapollo



Three interesting players in the pipes industry have been covered on the SOIC platform! 🎉
Apollo Pipes was highly requested company after we released Prince Pipes analysis.
Hope this matches the expectation of the community. 🙏
Apollo Pipes was highly requested company after we released Prince Pipes analysis.
Hope this matches the expectation of the community. 🙏
Another Superb Blog by @badola_arjun . This time on Apollo Pipes \U0001f3d7\ufe0f\U0001f3d7\ufe0f
— Intrinsic Compounding (@soicfinance) September 8, 2021
This completes our PVC/CPVC pipes industry analysis. Done with Astral,Prince and Apollo \U0001f600
Link to read\U0001f517: https://t.co/Ib40q9Fg3g pic.twitter.com/TlN1Urgp01



You May Also Like

Stan Lee’s fictional superheroes lived in the real New York. Here’s where they lived, and why. https://t.co/oV1IGGN8R6

Stan Lee, who died Monday at 95, was born in Manhattan and graduated from DeWitt Clinton High School in the Bronx. His pulp-fiction heroes have come to define much of popular culture in the early 21st century.
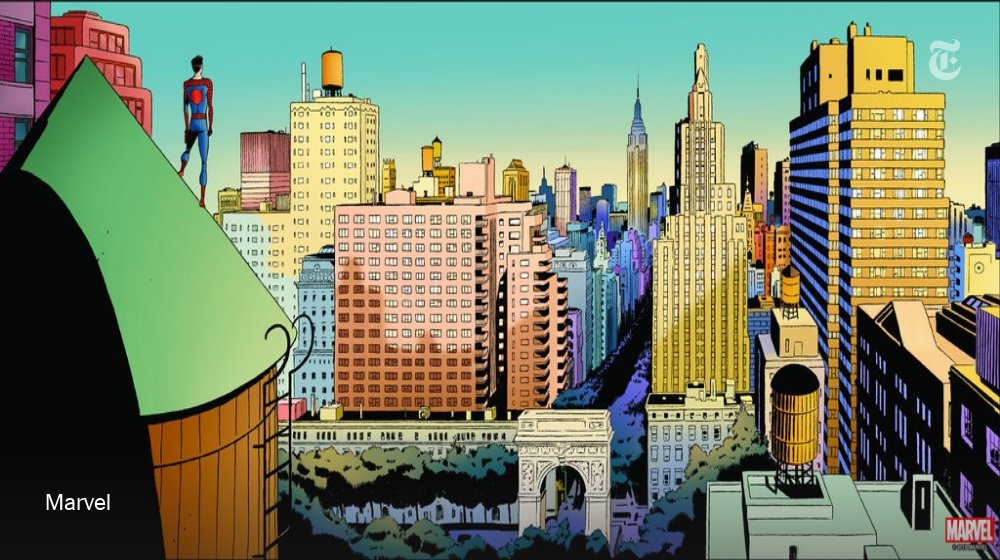
Tying Marvel’s stable of pulp-fiction heroes to a real place — New York — served a counterbalance to the sometimes gravity-challenged action and the improbability of the stories. That was just what Stan Lee wanted. https://t.co/rDosqzpP8i

The New York universe hooked readers. And the artists drew what they were familiar with, which made the Marvel universe authentic-looking, down to the water towers atop many of the buildings. https://t.co/rDosqzpP8i
The Avengers Mansion was a Beaux-Arts palace. Fans know it as 890 Fifth Avenue. The Frick Collection, which now occupies the place, uses the address of the front door: 1 East 70th Street.
Stan Lee, who died Monday at 95, was born in Manhattan and graduated from DeWitt Clinton High School in the Bronx. His pulp-fiction heroes have come to define much of popular culture in the early 21st century.
Tying Marvel’s stable of pulp-fiction heroes to a real place — New York — served a counterbalance to the sometimes gravity-challenged action and the improbability of the stories. That was just what Stan Lee wanted. https://t.co/rDosqzpP8i
The New York universe hooked readers. And the artists drew what they were familiar with, which made the Marvel universe authentic-looking, down to the water towers atop many of the buildings. https://t.co/rDosqzpP8i
The Avengers Mansion was a Beaux-Arts palace. Fans know it as 890 Fifth Avenue. The Frick Collection, which now occupies the place, uses the address of the front door: 1 East 70th Street.