
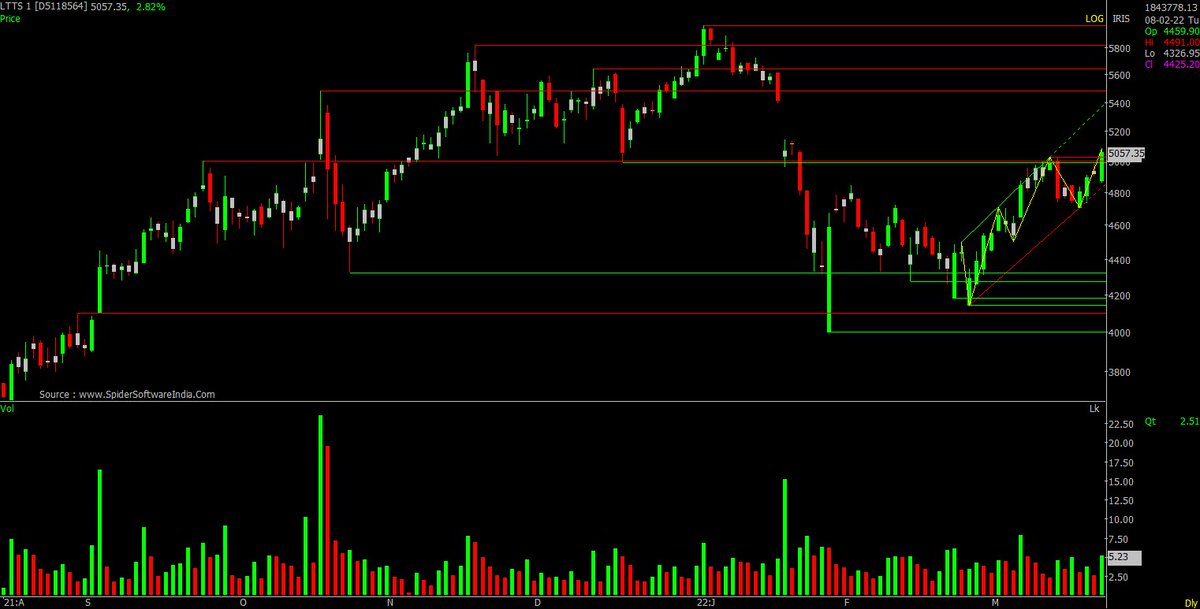
LTTS - now time for this. https://t.co/NqLWMJZWMq
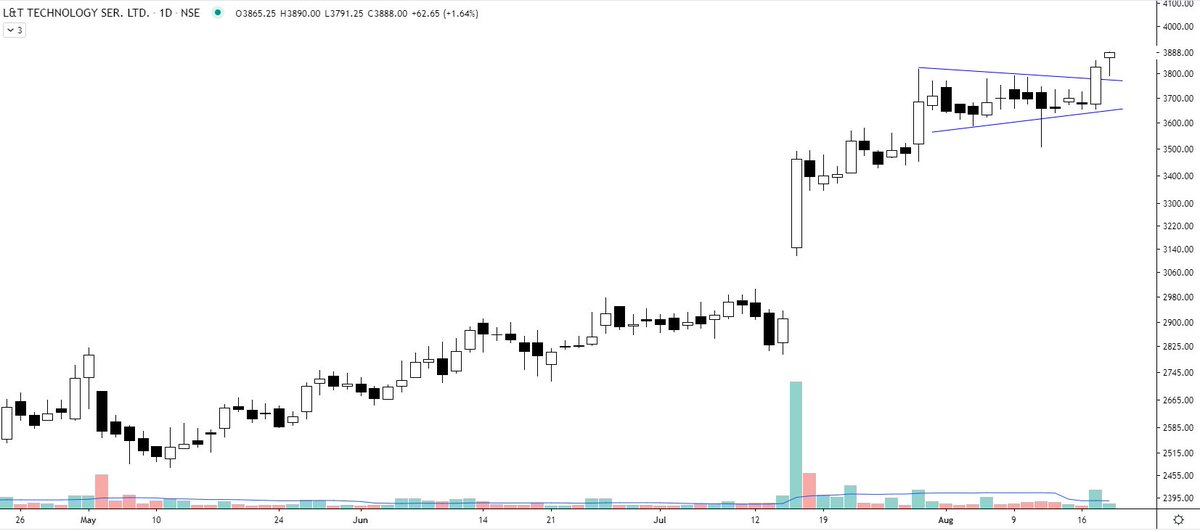
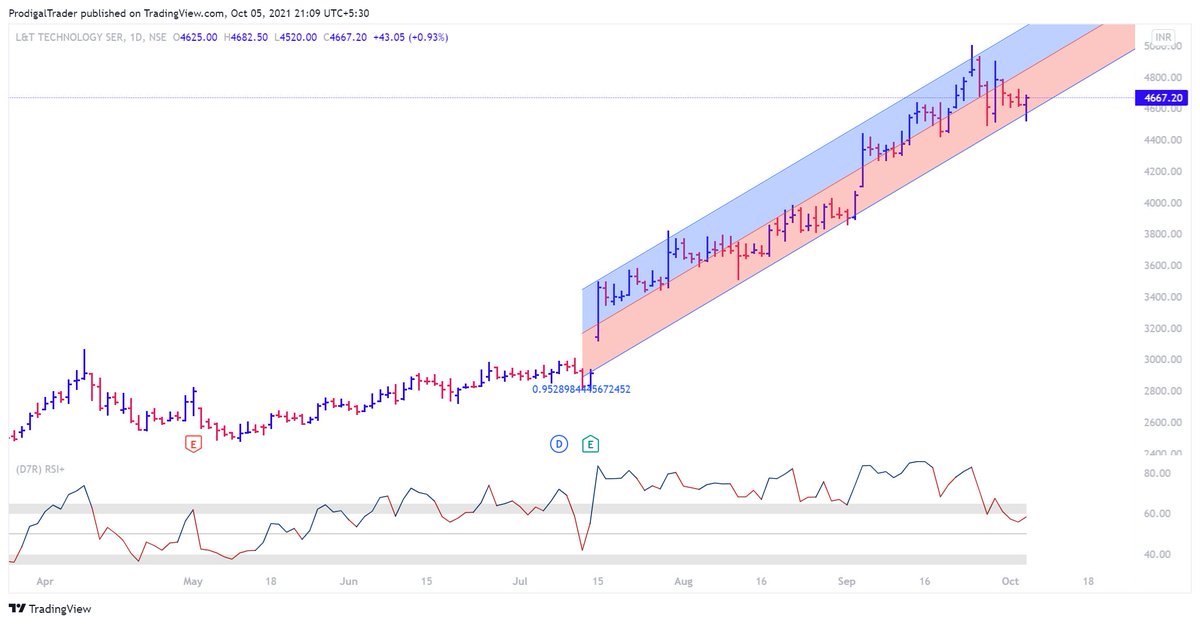
LTTS and Jubilant Food are in a strong uptrend - heading higher in my opinion.
— The_Chartist \U0001f4c8 (@nison_steve) August 18, 2021
More from The_Chartist 📈
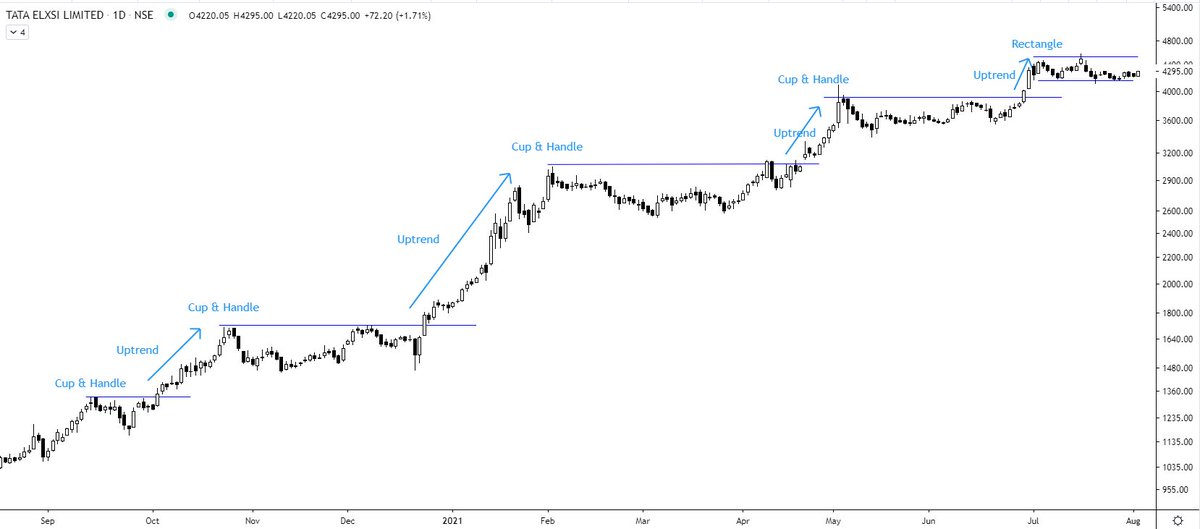
Tata Elxsi (W) - near to the resistance zone again 5th time. @nishkumar1977 @suru27 @rohanshah619 @indian_stockss @sanstocktrader @BissaGauravB @RajarshitaS @PAVLeader @Rishikesh_ADX @VijayThk @Investor_Mohit @TrendTrader85 @jitendra_stock pic.twitter.com/aIC5kO8XqA
— Steve Nison (@nison_steve) December 18, 2020
It is important to analyse the strength of the breakout. If the price does not continues the move in 1 or 2 sessions and candles show long upper wicks, it is better to bring the SL closer. Distribution sign.
Will be helpful in next breakouts. https://t.co/AtZOj4bKeT
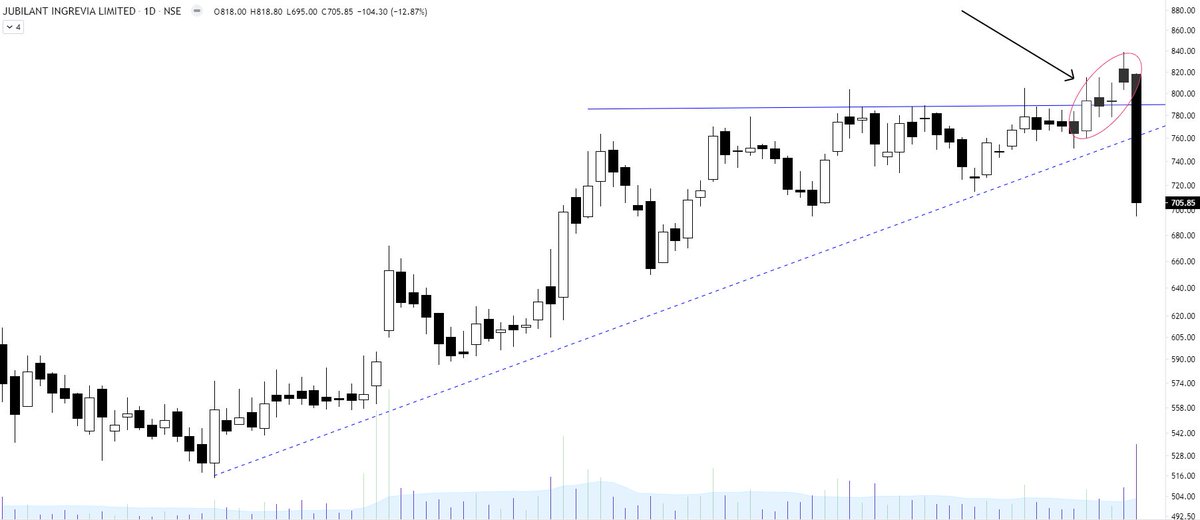
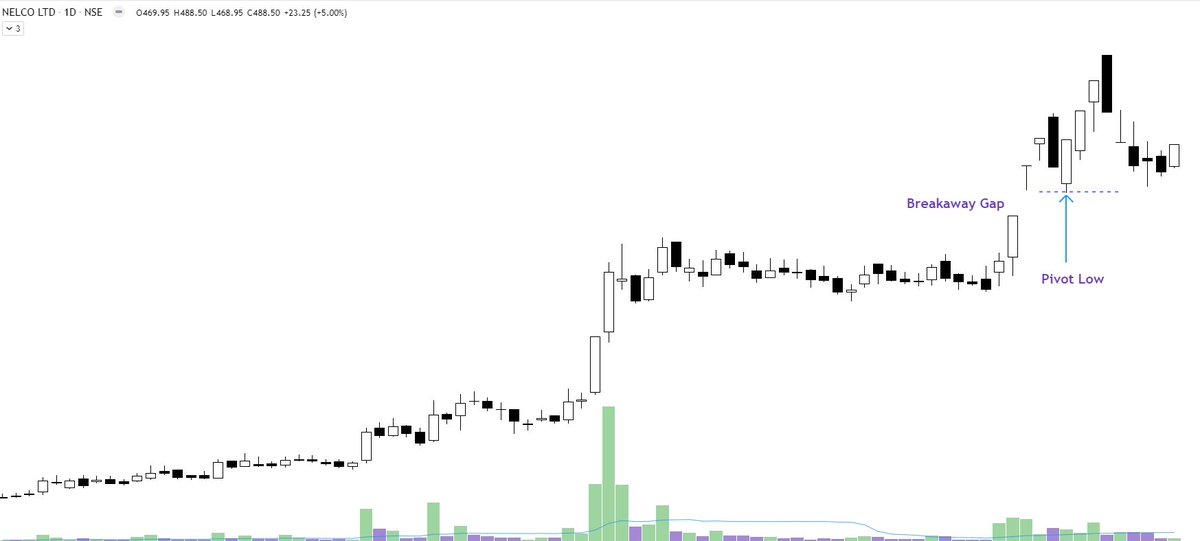
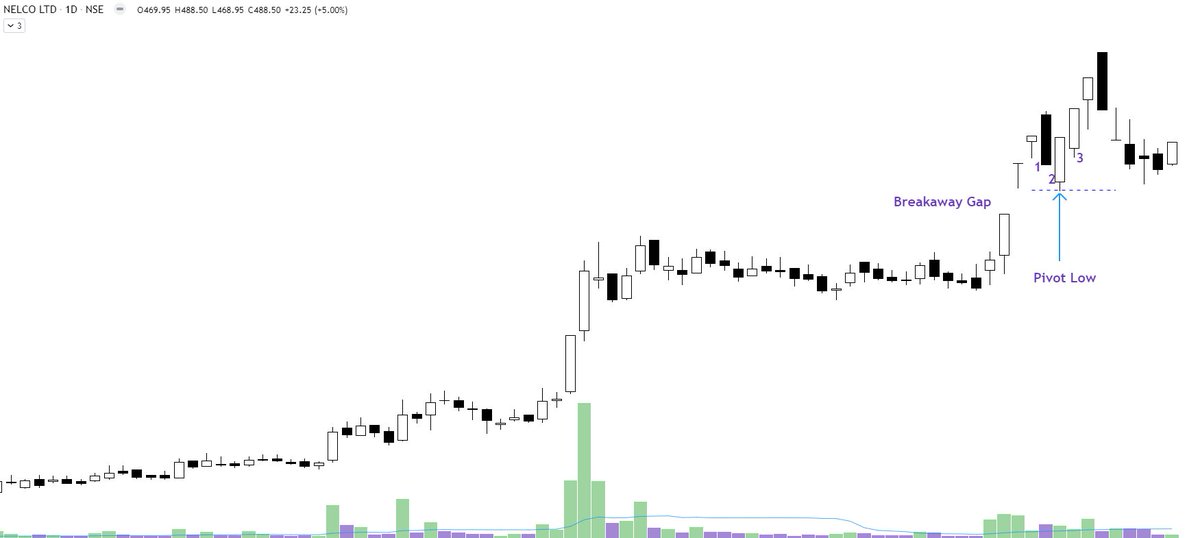
Learning: Strong breakout
— The_Chartist \U0001f4c8 (@nison_steve) July 2, 2021
1. Breakout candle will have no upper shadow or extremely less compared to the body
2. Volumes will be high (to avoid retailers to enter & also big hand absorbing all the selling)
3. Pullbacks will be rare/very less
4. Happens after a long consolidation pic.twitter.com/YTHDOnEdxo

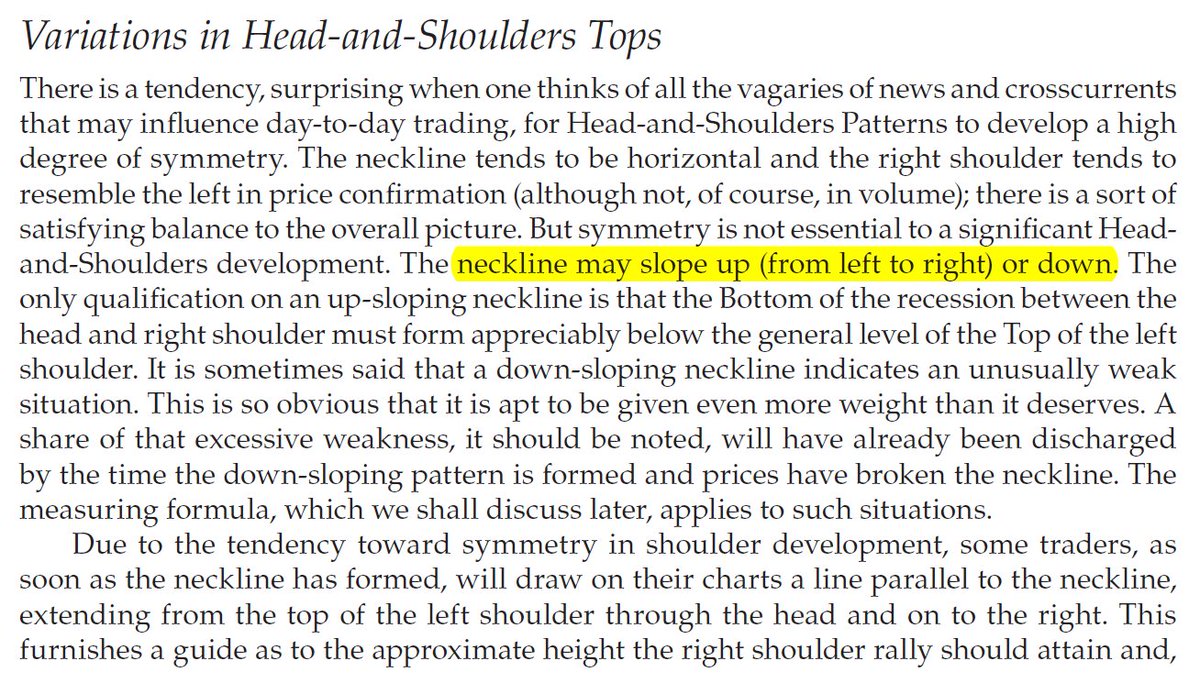
Sir Edwards & Magee discussed sloping necklines in H&S in their classical work. I am considering this breakdown by Affle as an H&S top breakdown with a target open of 770.
— The_Chartist \U0001f4c8 (@charts_zone) May 25, 2022
The target also coincides with support at the exact same level. pic.twitter.com/n84kSgkg4q
Fresh case - RUPA https://t.co/nqq5nI1wLU
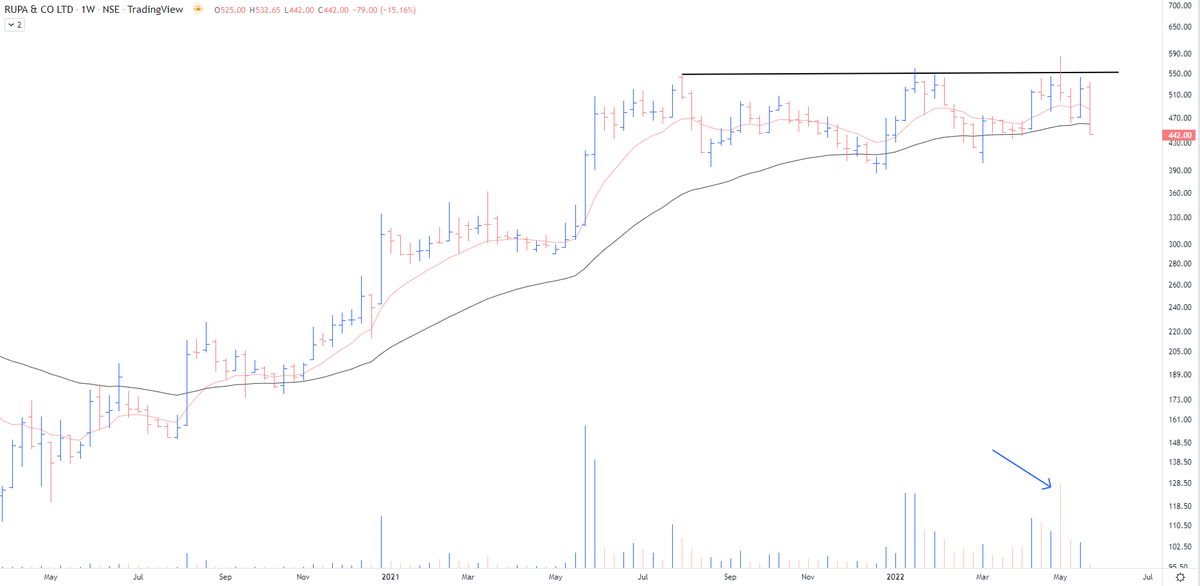
Respect your stop losses in the stocks that have gone down today with heavy volumes even on a strong day.
— The_Chartist \U0001f4c8 (@charts_zone) March 17, 2022
VTL pic.twitter.com/3pJ9XngCDL
More from Ltts

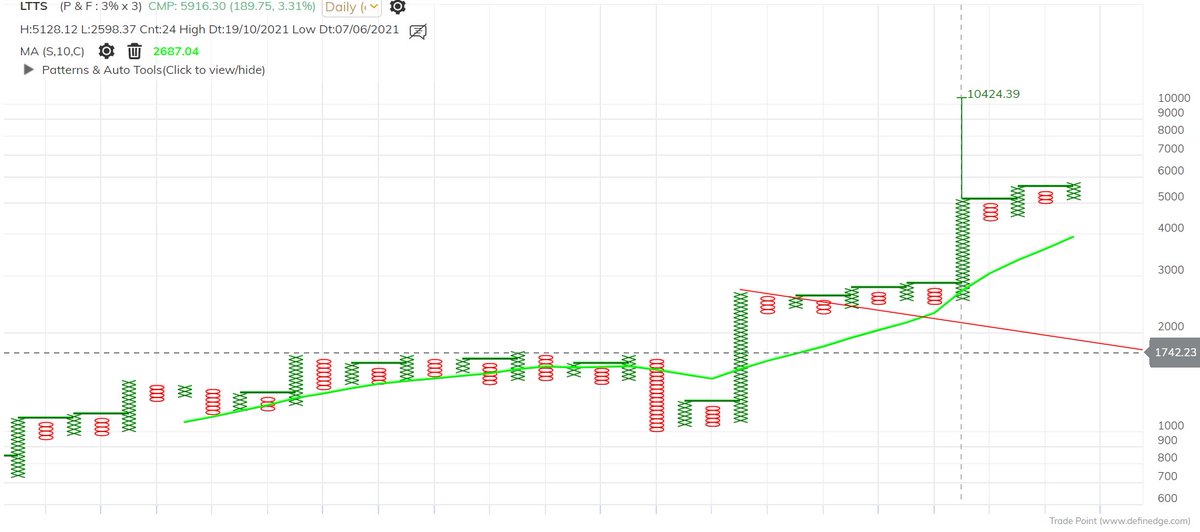


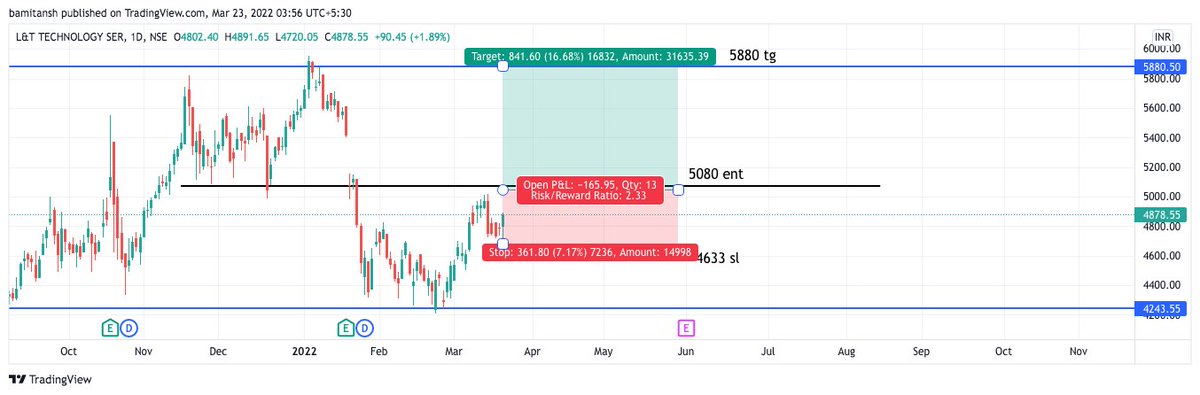
Objective is to move higher towards Fibonacci extension
6.857%..(6892)
#Probability
#LTTS-4897
— Waves_Perception(Dinesh Patel) \u092e\u0948\u0902Schedule Tribes) (@idineshptl) October 14, 2021
Sustain rise above 4.618%(4967)
Upside projection ploted on chart
6.857%(6892)#Probability https://t.co/h28c8TImIG

You May Also Like


==========================
Module 1
Python makes it very easy to analyze and visualize time series data when you’re a beginner. It's easier when you don't have to install python on your PC (that's why it's a nano course, you'll learn python...
... on the go). You will not be required to install python in your PC but you will be using an amazing python editor, Google Colab Visit https://t.co/EZt0agsdlV
This course is for anyone out there who is confused, frustrated, and just wants this python/finance thing to work!
In Module 1 of this Nano course, we will learn about :
# Using Google Colab
# Importing libraries
# Making a Random Time Series of Black Field Research Stock (fictional)
# Using Google Colab
Intro link is here on YT: https://t.co/MqMSDBaQri
Create a new Notebook at https://t.co/EZt0agsdlV and name it AnythingOfYourChoice.ipynb
You got your notebook ready and now the game is on!
You can add code in these cells and add as many cells as you want
# Importing Libraries
Imports are pretty standard, with a few exceptions.
For the most part, you can import your libraries by running the import.
Type this in the first cell you see. You need not worry about what each of these does, we will understand it later.

