LAURUSLABS
Haters are gonna hate, but IMO, this is the best opportunity to start pyramiding and make it a well sized holding.
A trio of patterns coming together, has one of the highest success rate!
Double Top Buy, T20 Pattern - Bullish & Super pattern - Bullish above 477.81! https://t.co/SqzkTyb9wx
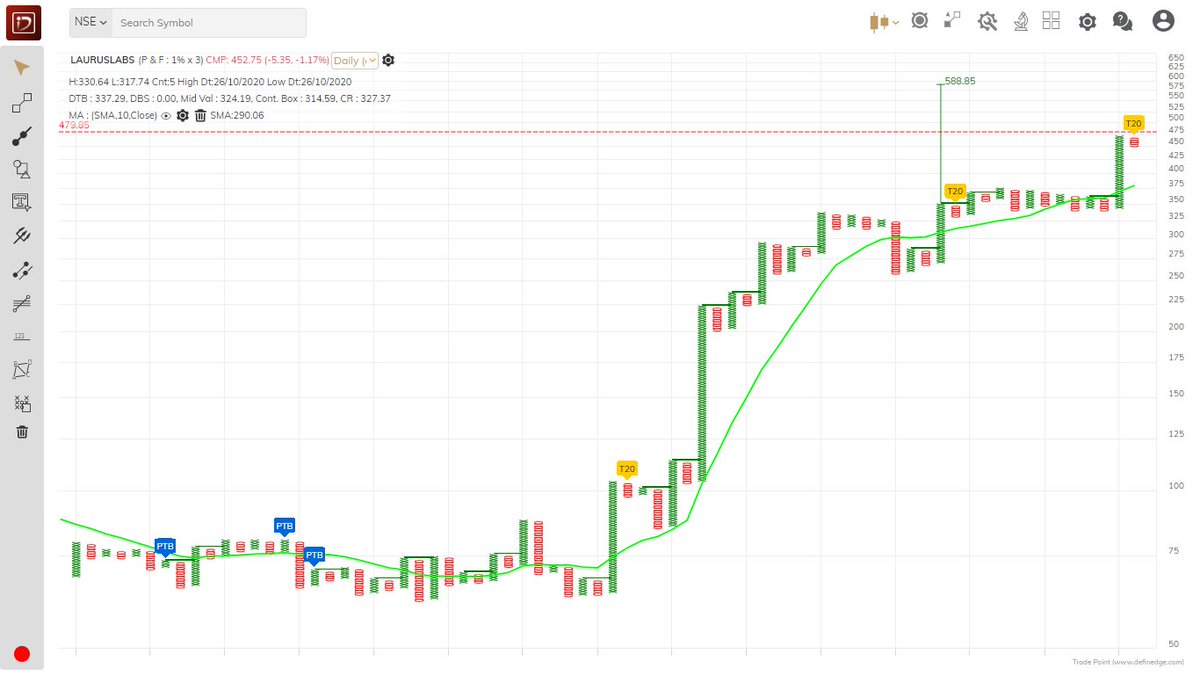
LAURUSLABS
— Saket Reddy (@saketreddy) December 17, 2020
There was no entry in Oct as the stock didn't close above 340.
Don't chase & don't buy it for short term.
Now, DTB above 348.15 daily close (Now trading at similar levels).
Wait for close above it or check if it's above the trigger price after 15:20 and enter. https://t.co/vh5hZpjJER pic.twitter.com/EprcgeLSqb
More from Saket Reddy
Double Top Buy & T20 Pattern - Bullish above 4058.33 daily close on 1% Box Size chart. https://t.co/DPEehZwkS4
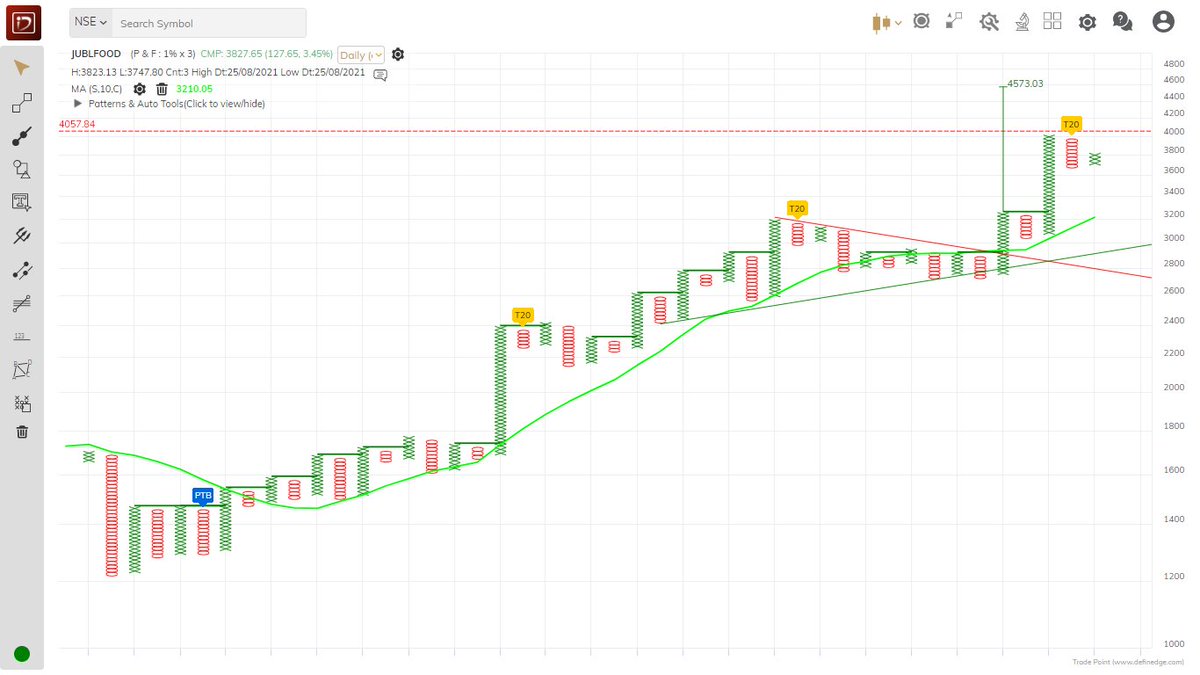
JUBLFOOD
— Saket Reddy (@saketreddy) June 24, 2020
Achieved the second target of 1820 today, now near the first target of 1780!
Got a nice 15-20% move till now.
Trailing stop loss is the best thing one can do now! https://t.co/YidPZamyxz
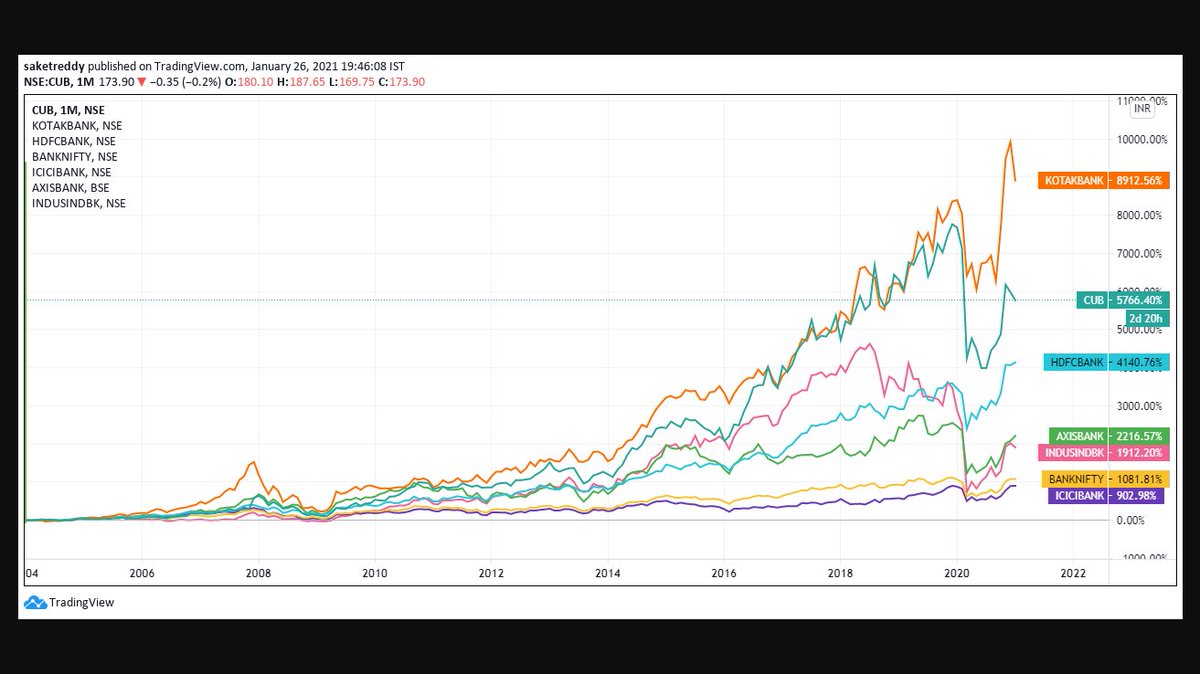
They are the real compounders, they've created massive wealth compared to others! https://t.co/PluVwU5OXG
Hope Everyone saw BANDHANBNK Numbers. I feel many such banks will go through a massive NPA Cycle followed by depleted Tier 1.
— Saket Reddy (@saketreddy) January 24, 2021
Hence, stay with the Top 3 banks :-
HDFCBANK
KOTAKBANK
CUB
They've low cost of funding, well provisioned Moratorium book, high ROEs & high Tier 1 CAR.
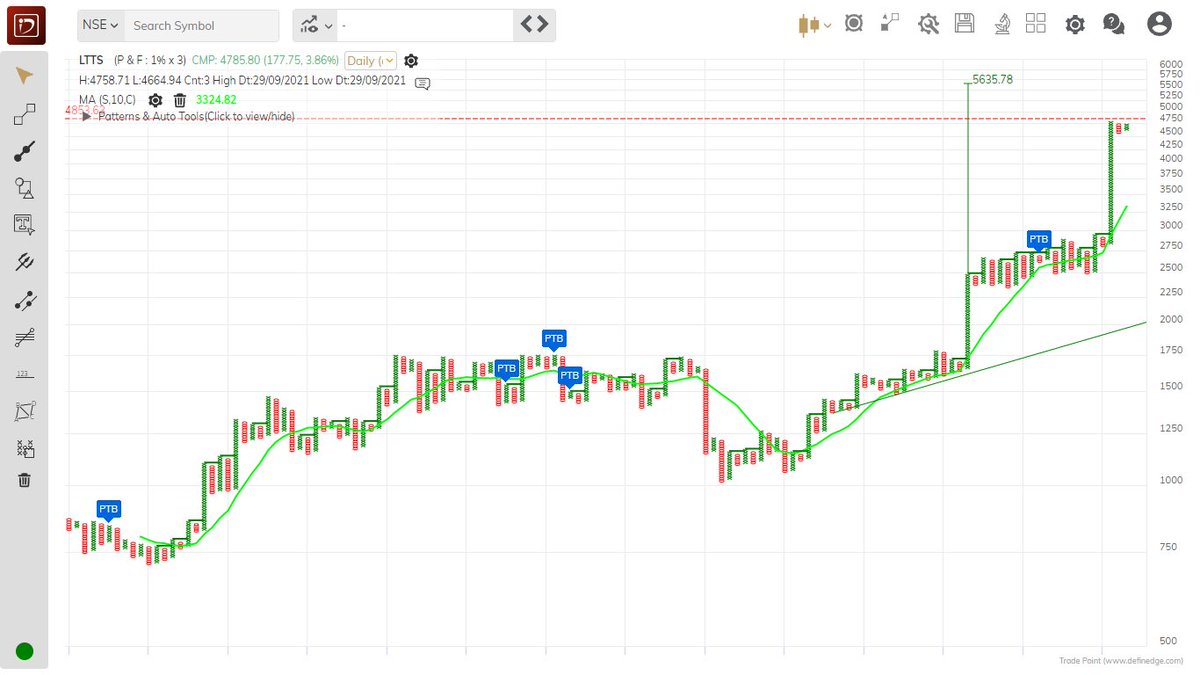
More from Lauruslabs

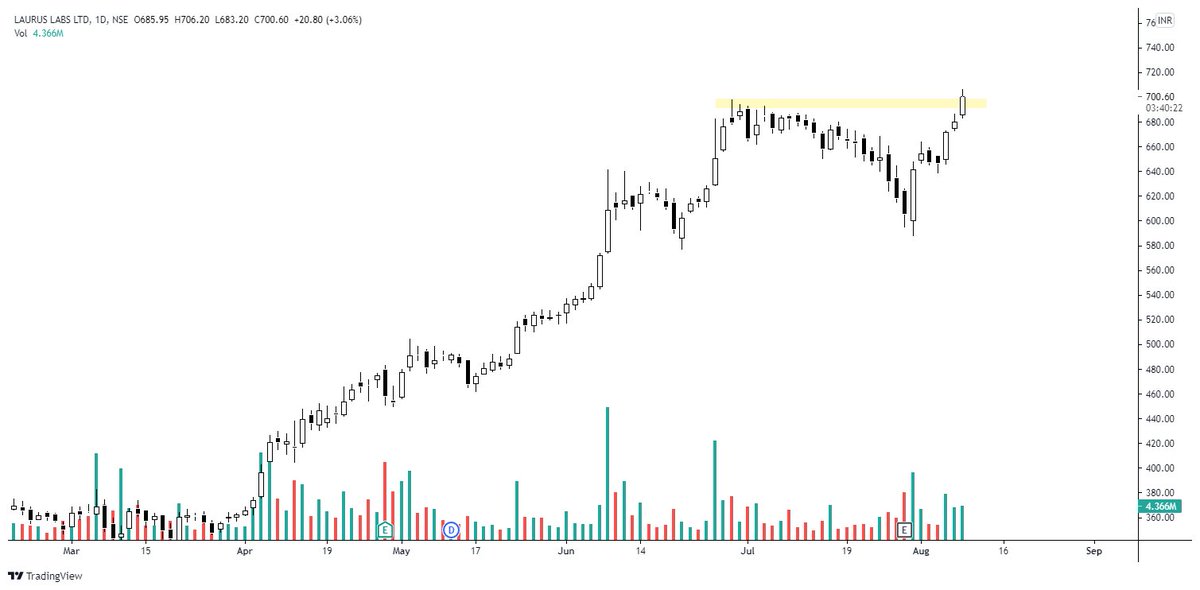


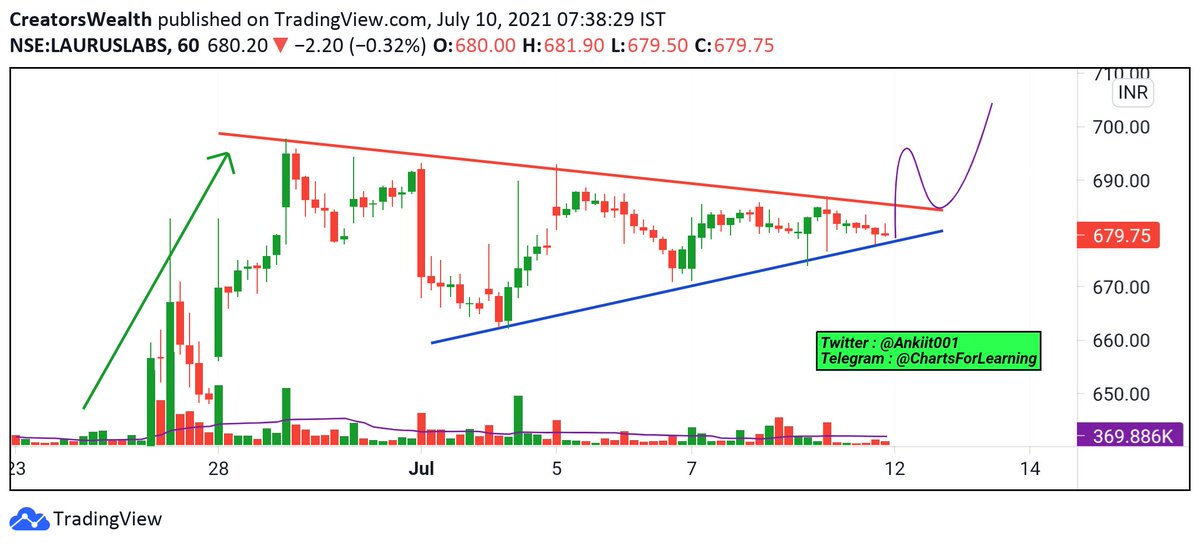

Time to Pyramid!
Double Top Buy, T20 Pattern - Bullish & Super Pattern - Bullish above 707.72 daily close on 3% Box Size chart. https://t.co/3jyru5LSpN
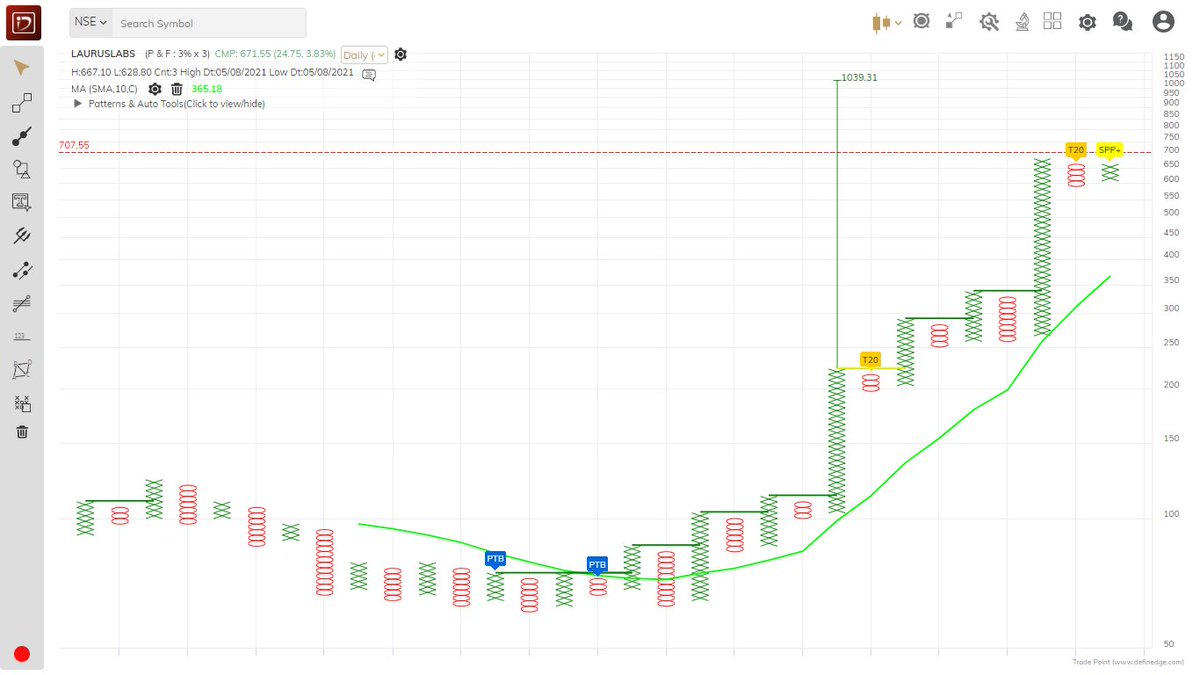
LAURUSLABS
— Saket Reddy (@saketreddy) June 22, 2021
Haters are still hating it, time to pyramid once again!
Double Top Buy, T20 Pattern - Bullish & Super Pattern - Bullish above 625.07 daily close on 1% Box Size chart. https://t.co/EDqa7dAAKn pic.twitter.com/Evj76taKId