
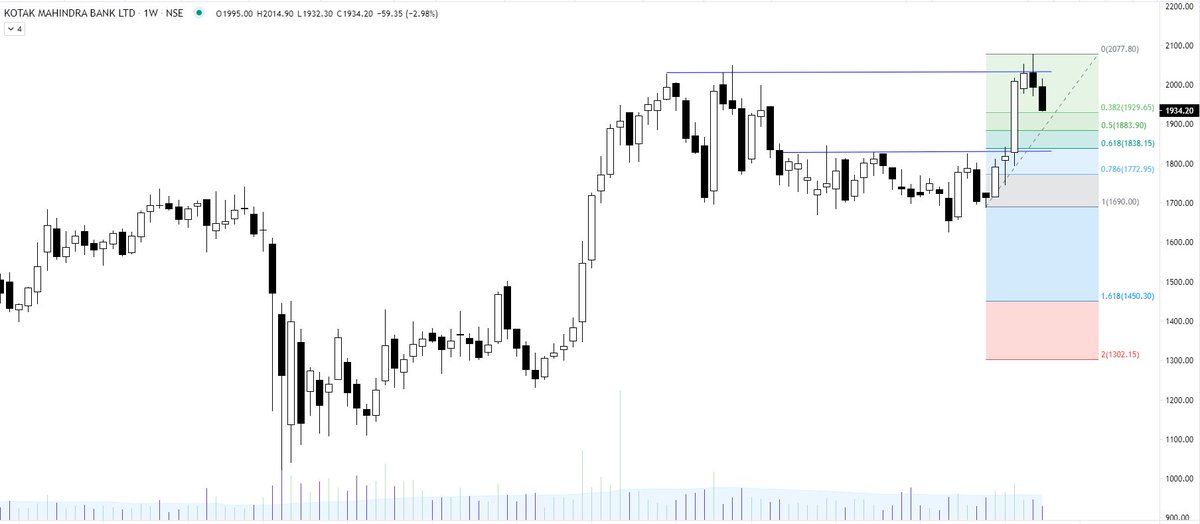
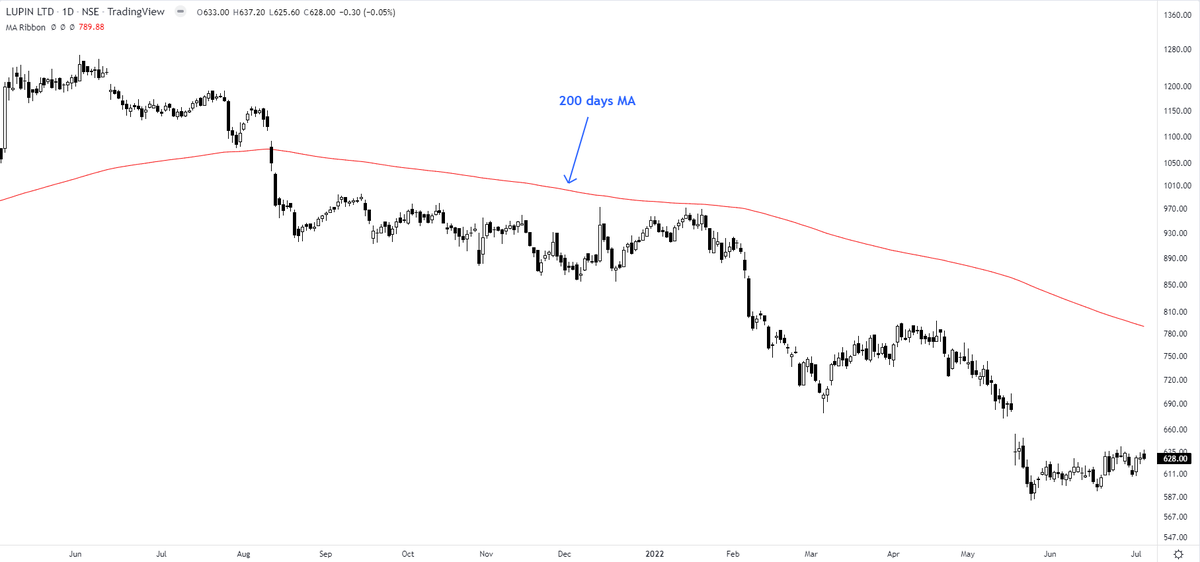
Analyse with me please. U may see it faced res. at ATH levels & came back. also it was a strong move before till that level. Now u may see Fib. levels of 38 & 61.8 will act as support. My advice to you - If you are trader, stick with the strongest counters.
More from The_Chartist 📈
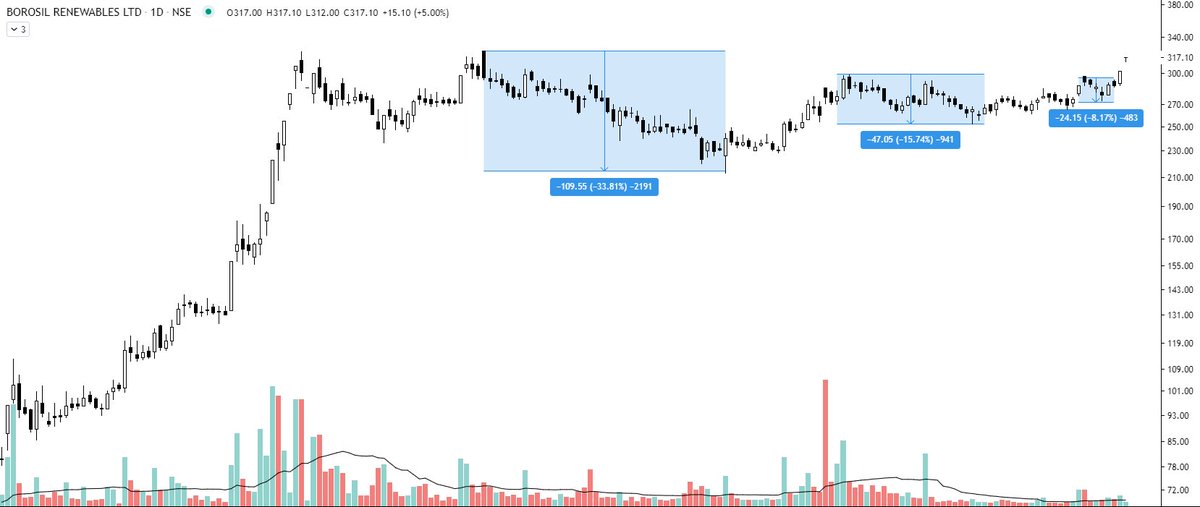
Borosil Renewables - Patterns like these must be looked at carefully and must be kept on the radar. Herein price is contracting which generally signifies shifting of hands (from weak to strong). If you go wrong, the risk is limited in these. pic.twitter.com/iqyoeslZjy
— Steve Nison (@nison_steve) July 12, 2021
More from Kotakbank

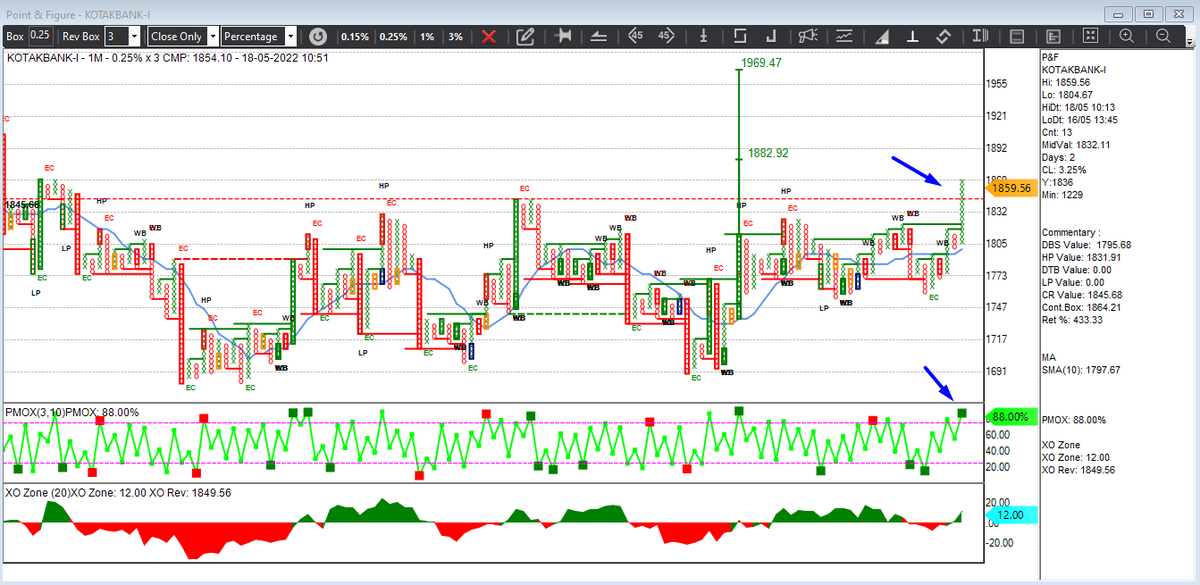


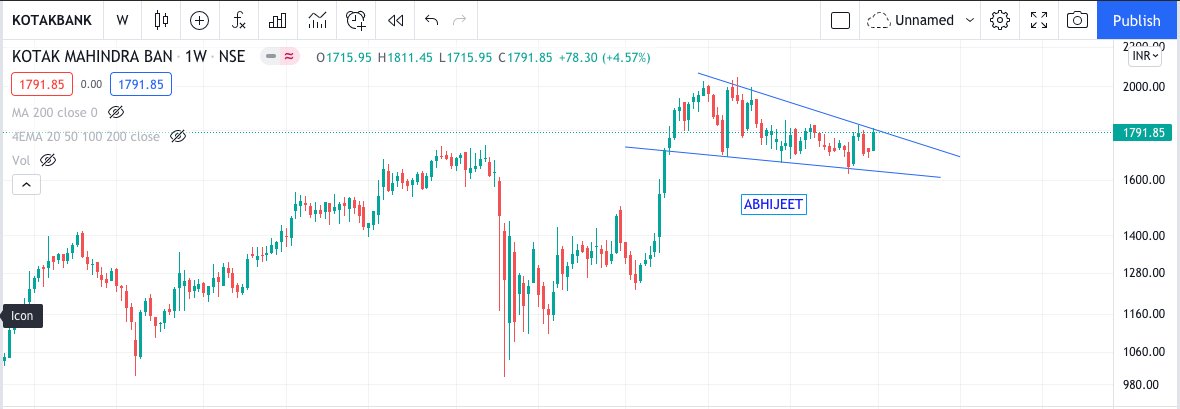

Midway resistances held up strong.
Once these are breached, It is poised for more towards 1950 followed by 2000.
#StockMarket #StocksInFocus https://t.co/kswtnvjQM8
#KOTAKBANK
— Gurleen (@GurleenKaur_19) August 8, 2021
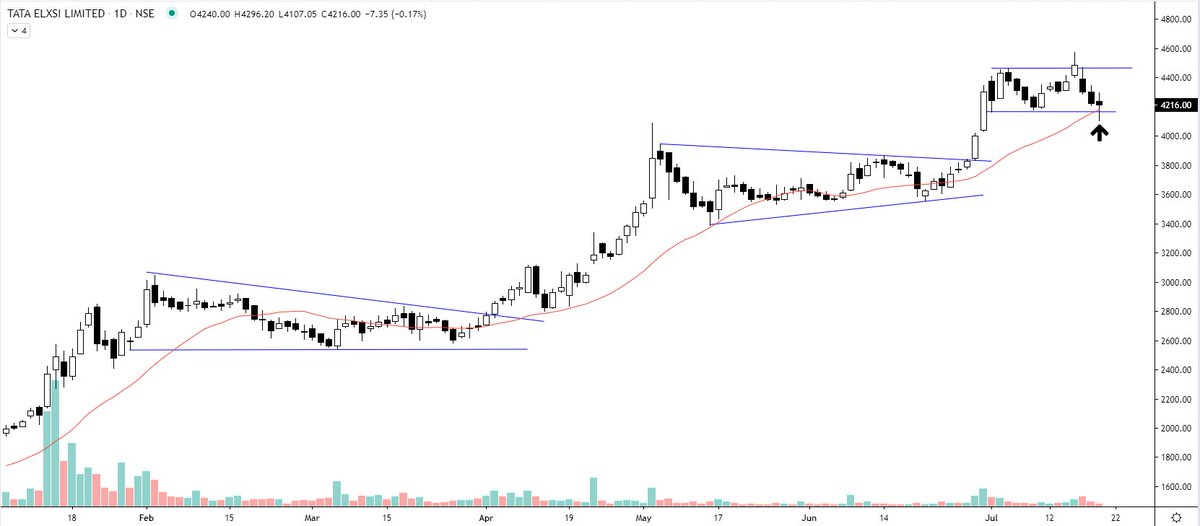
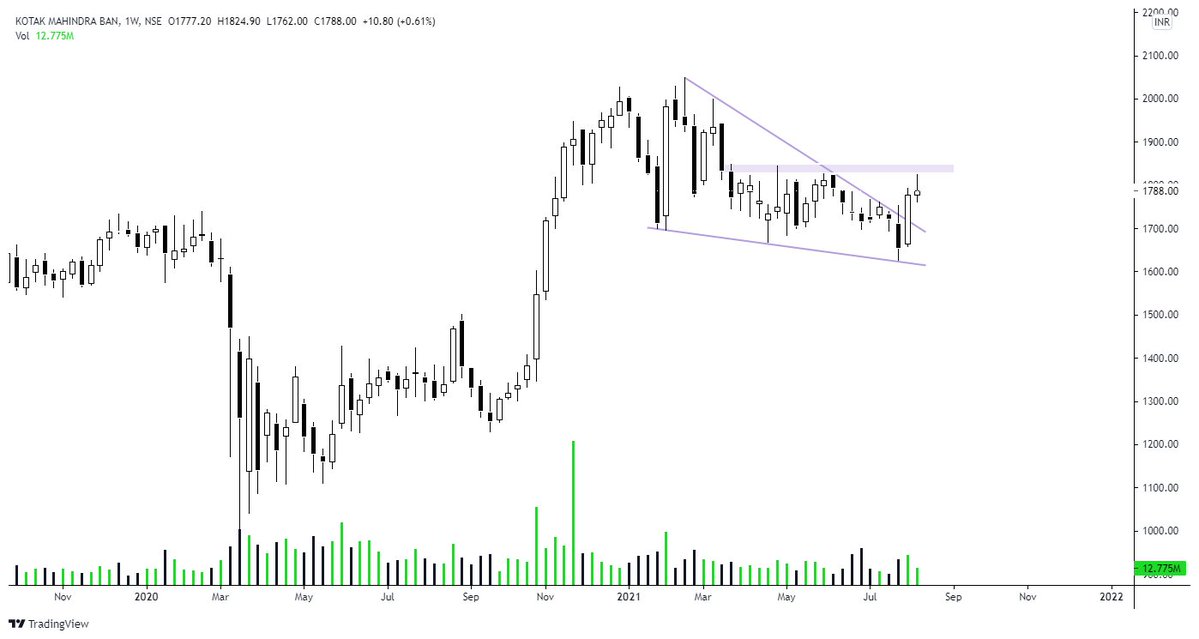
In daily; Trendline breakout along with price volume action.
Resistances midway at 1812.70 and 1856.75.
Once these are breached, It is poised for more towards 1950 followed by 2000.
In weekly as well; Setup looks quite bullish. #StockMarket #StocksToTrade pic.twitter.com/vfIjR7MuCE

You May Also Like


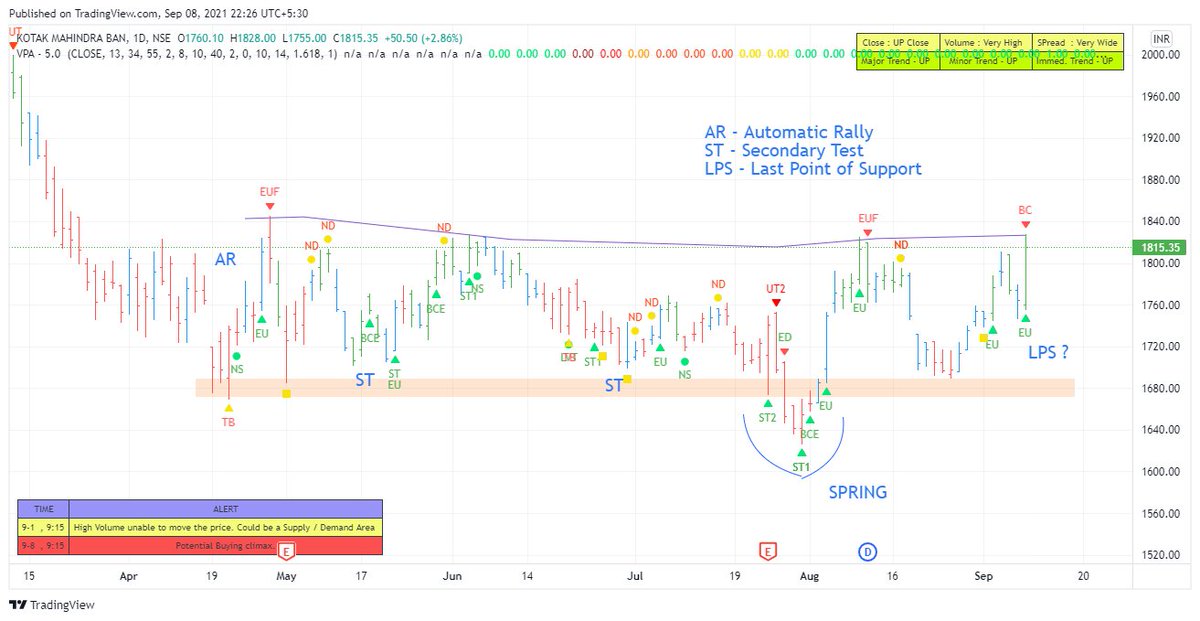
Covering one of the most unique set ups: Extended moves & Reversal plays
Time for a 🧵 to learn the above from @iManasArora
What qualifies for an extended move?
30-40% move in just 5-6 days is one example of extended move
How Manas used this info to book
The stock exploded & went up as much as 63% from my price.
— Manas Arora (@iManasArora) June 22, 2020
Closed my position entirely today!#BroTip pic.twitter.com/CRbQh3kvMM
Post that the plight of the
What an extended (away from averages) move looks like!!
— Manas Arora (@iManasArora) June 24, 2020
If you don't learn to sell into strength, be ready to give away the majority of your gains.#GLENMARK pic.twitter.com/5DsRTUaGO2
Example 2: Booking profits when the stock is extended from 10WMA
10WMA =
#HIKAL
— Manas Arora (@iManasArora) July 2, 2021
Closed remaining at 560
Reason: It is 40+% from 10wma. Super extended
Total revenue: 11R * 0.25 (size) = 2.75% on portfolio
Trade closed pic.twitter.com/YDDvhz8swT
Another hack to identify extended move in a stock:
Too many green days!
Read
When you see 15 green weeks in a row, that's the end of the move. *Extended*
— Manas Arora (@iManasArora) August 26, 2019
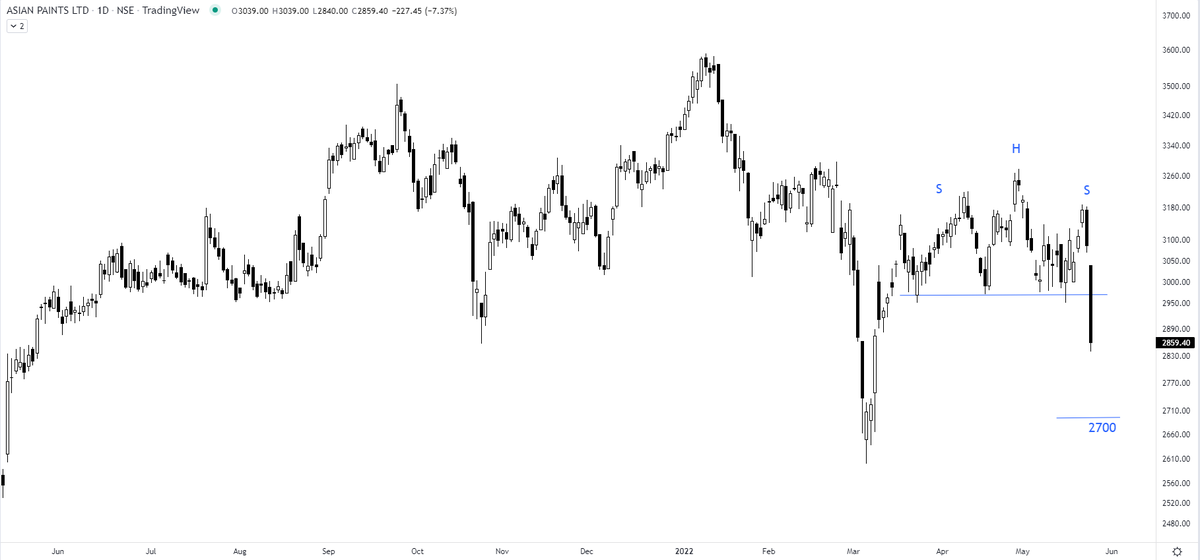
Simple price action analysis.#Seamecltd https://t.co/gR9xzgeb9K


A thread 🧵
1) Learn Anything - Search tools for knowledge discovery that helps you understand any topic through the most efficient
2) Grad Speeches - Discover the best commencement speeches.
This website is made by me
3) What does the Internet Think - Find out what the internet thinks about anything
4) https://t.co/vuhT6jVItx - Send notes that will self-destruct after being read.