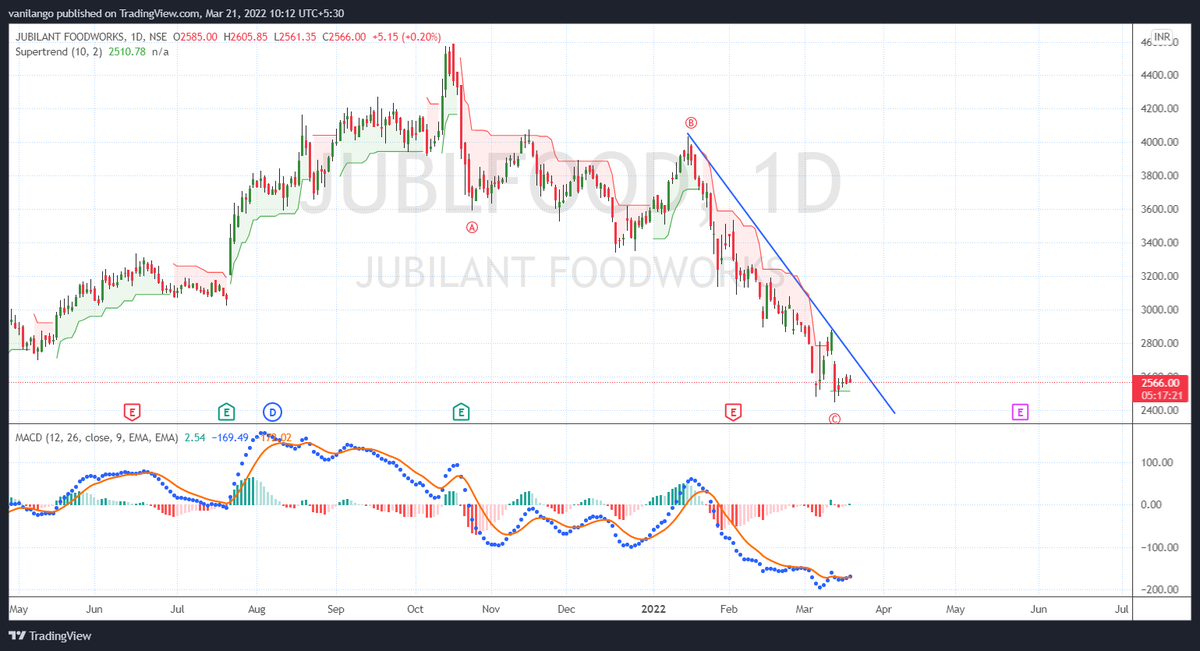
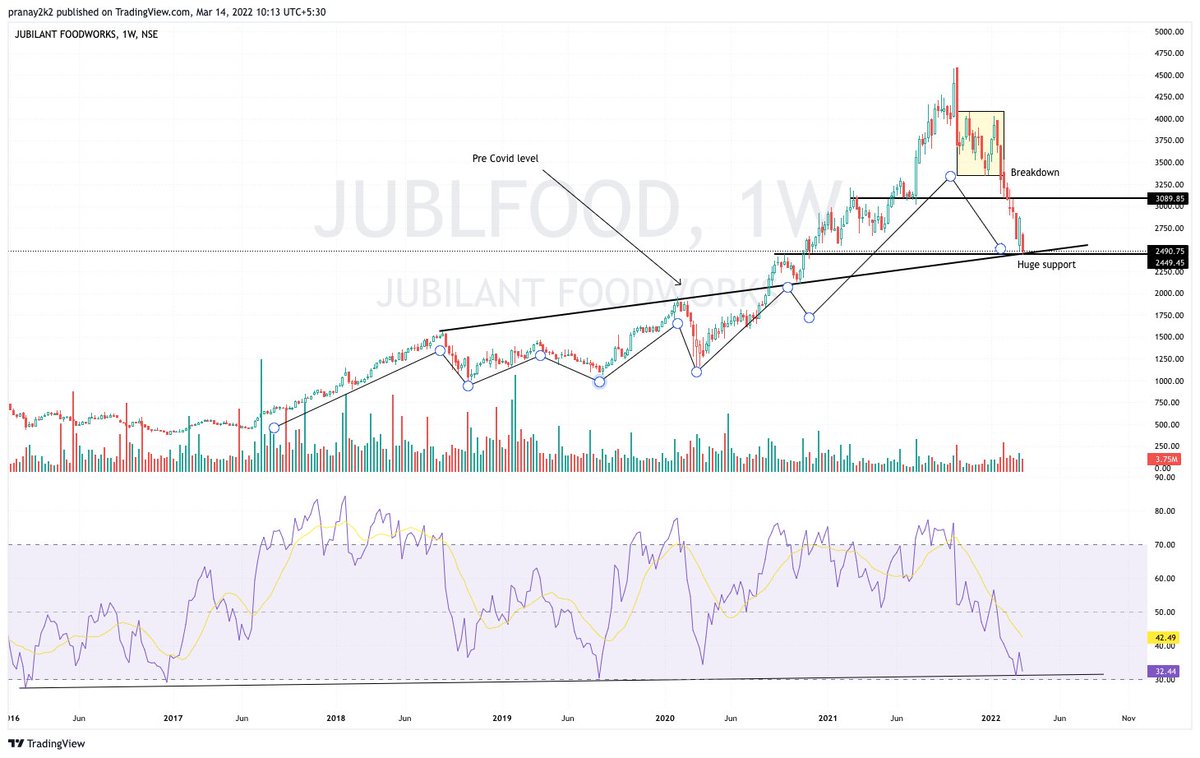
#jubilantfoodworks @ 2443, an "abc" correction is "almost" done fm 4575
Holding 2500 & moving past 2615 would be the 1st sign of reversal attempt
Only +ve factor "Highly oversold"-meant for aggressive traders
Conservative traders wait for some "Bull candle" formation in Day t/f https://t.co/NbwmqJxo0W
sir view on jubilant food works pls
— om namo venkatesaya (@being__trader) March 21, 2022
More from Van Ilango (JustNifty)
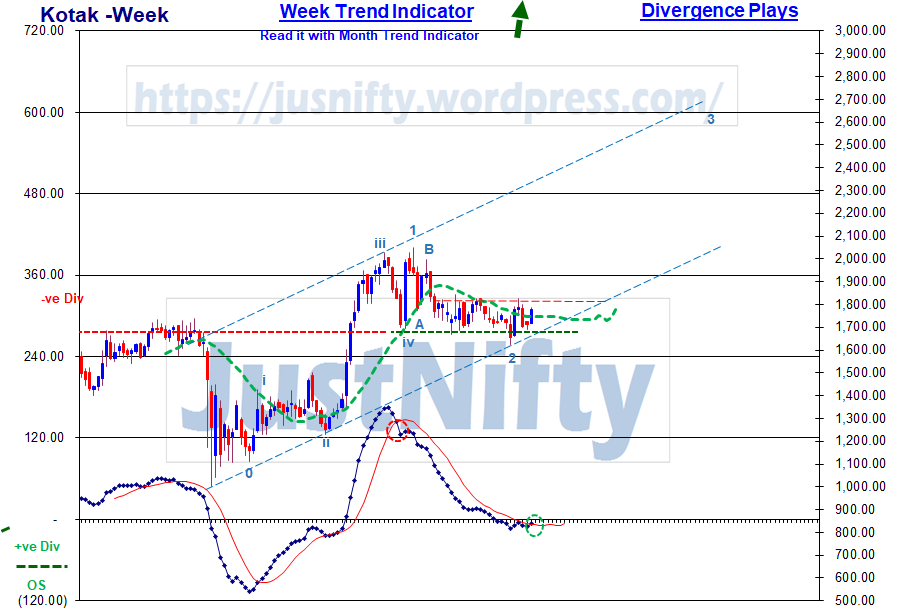
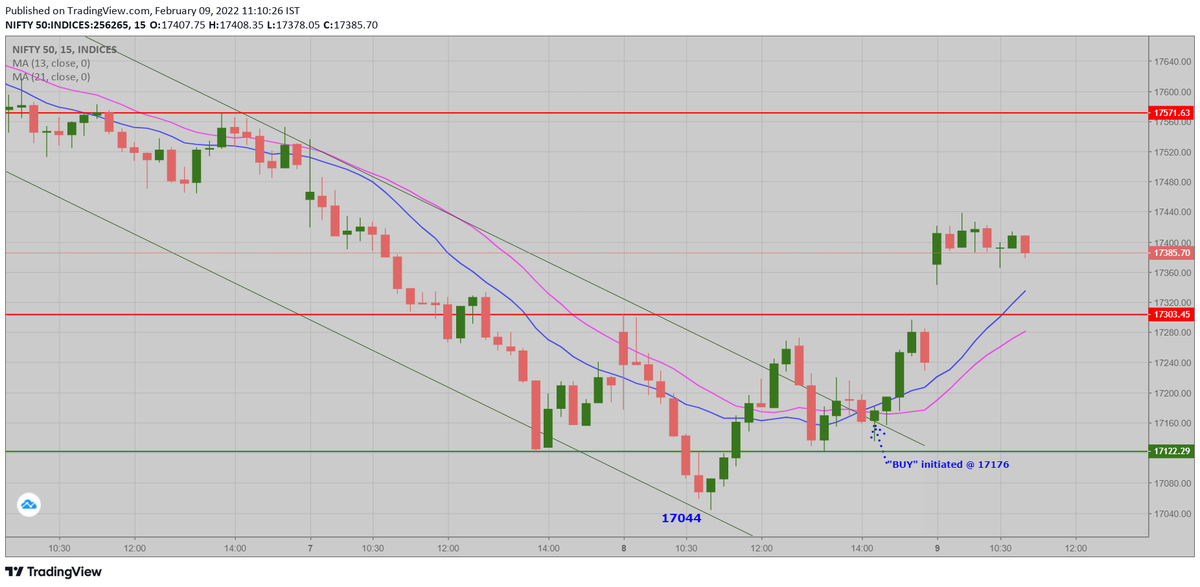
Holding 660 & 680, poised for big run in the days, weeks & months ahead.
Volume goes with rises
Thank you.\U0001f64f
— Van Ilango (JustNifty) (@JustNifty) August 18, 2021
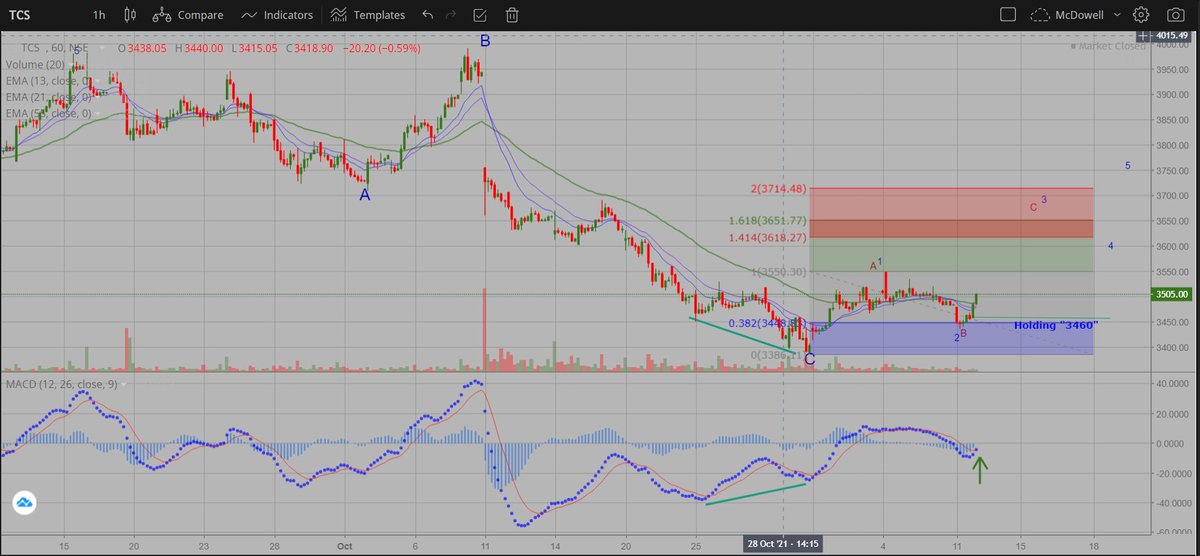
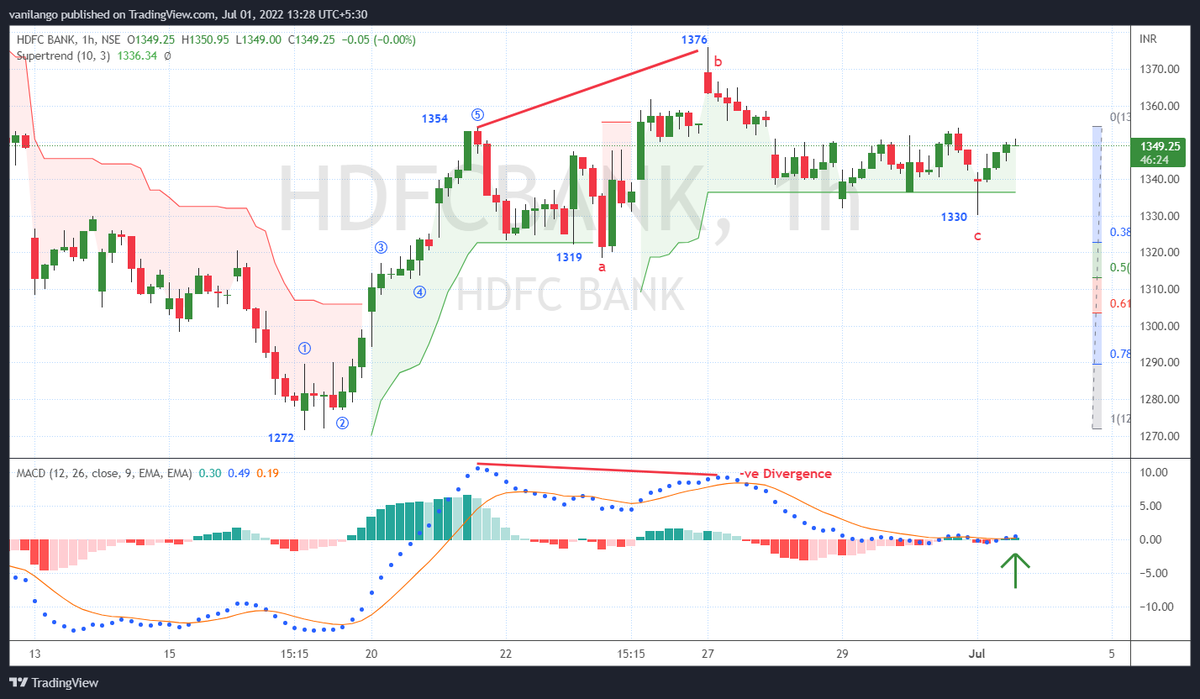
A fresh input for you. #McDowell
A major triangle break out in the coming months.
Presently poised to move out of recent consolidation pic.twitter.com/J15F06ODUq
More from Jublfood


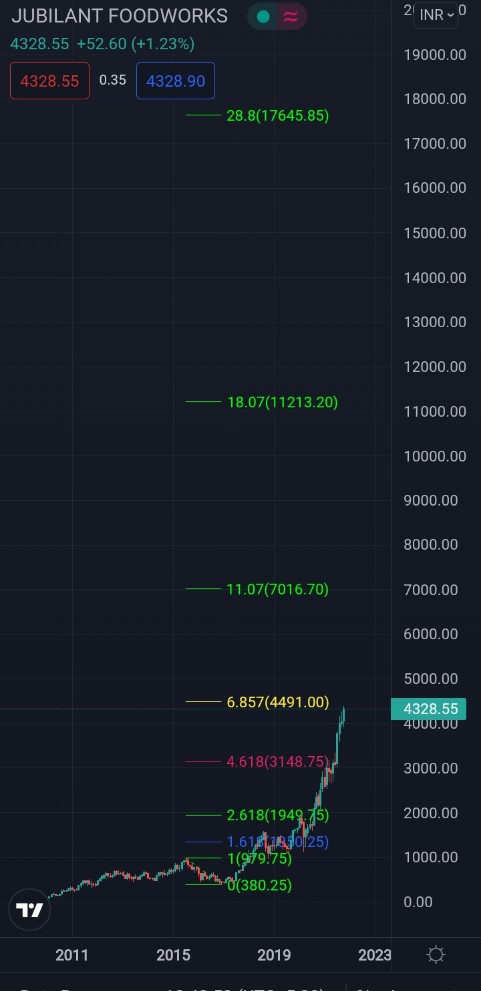
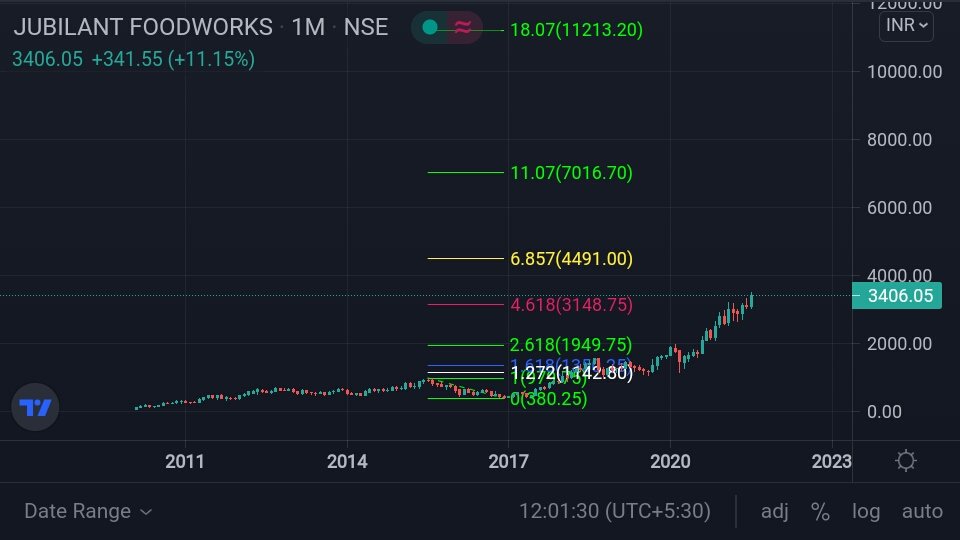
As the stock price trying to enter in to
new Orbit (#Fibonacci extension6.857%(4491)
Further Fibonacci extension projection ploted on chart.
Long term perspective.
#Probability https://t.co/fPSLKLDxln
#JUBLFOOD -3940
— Waves_Perception(Dinesh Patel) \u092e\u0948\u0902Schedule Tribes) (@idineshptl) August 17, 2021
Moving higher towards objective
6.857%(4491)#Probability https://t.co/oKppKL59mG


You May Also Like

Like company moats, your personal moat should be a competitive advantage that is not only durable—it should also compound over time.
Characteristics of a personal moat below:
I'm increasingly interested in the idea of "personal moats" in the context of careers.
— Erik Torenberg (@eriktorenberg) November 22, 2018
Moats should be:
- Hard to learn and hard to do (but perhaps easier for you)
- Skills that are rare and valuable
- Legible
- Compounding over time
- Unique to your own talents & interests https://t.co/bB3k1YcH5b
2/ Like a company moat, you want to build career capital while you sleep.
As Andrew Chen noted:
People talk about \u201cpassive income\u201d a lot but not about \u201cpassive social capital\u201d or \u201cpassive networking\u201d or \u201cpassive knowledge gaining\u201d but that\u2019s what you can architect if you have a thing and it grows over time without intensive constant effort to sustain it
— Andrew Chen (@andrewchen) November 22, 2018
3/ You don’t want to build a competitive advantage that is fleeting or that will get commoditized
Things that might get commoditized over time (some longer than
Things that look like moats but likely aren\u2019t or may fade:
— Erik Torenberg (@eriktorenberg) November 22, 2018
- Proprietary networks
- Being something other than one of the best at any tournament style-game
- Many "awards"
- Twitter followers or general reach without "respect"
- Anything that depends on information asymmetry https://t.co/abjxesVIh9
4/ Before the arrival of recorded music, what used to be scarce was the actual music itself — required an in-person artist.
After recorded music, the music itself became abundant and what became scarce was curation, distribution, and self space.
5/ Similarly, in careers, what used to be (more) scarce were things like ideas, money, and exclusive relationships.
In the internet economy, what has become scarce are things like specific knowledge, rare & valuable skills, and great reputations.