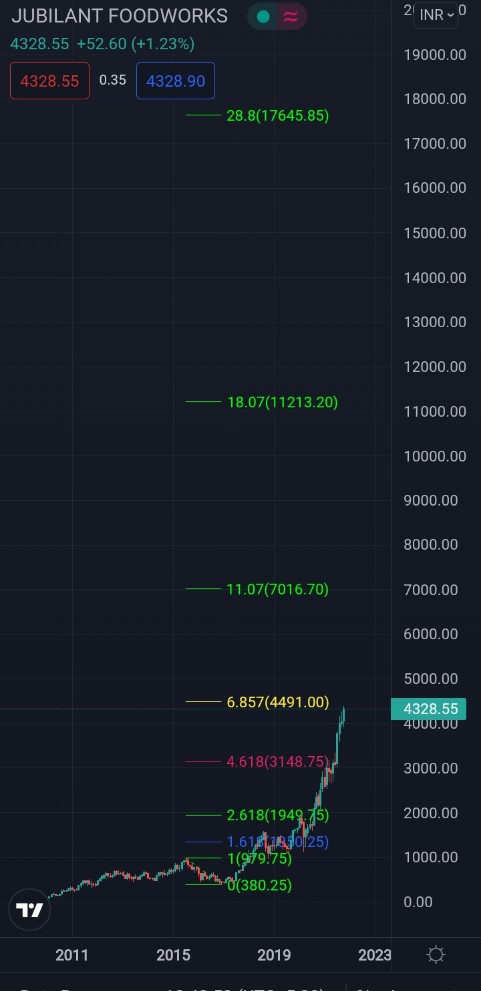
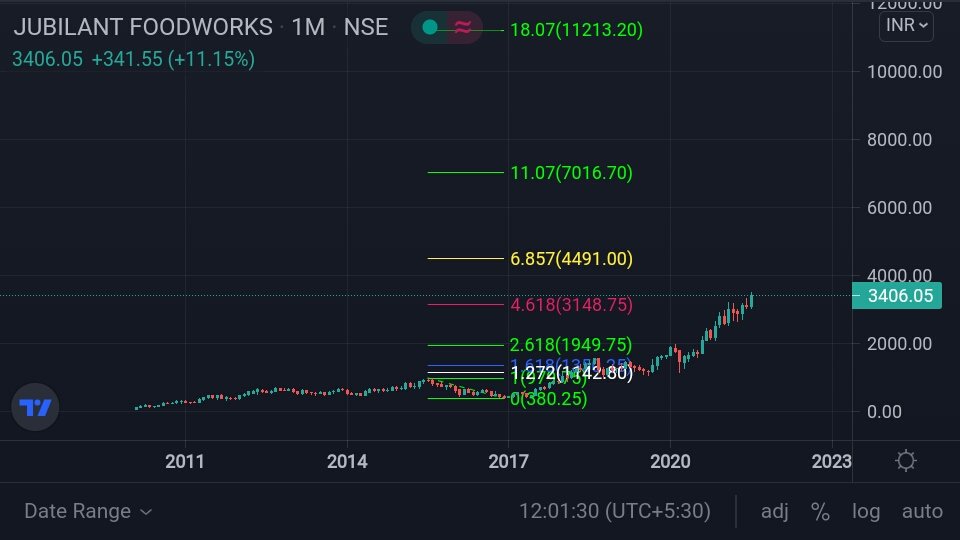
#JUBLFOOD-4362
As the stock price trying to enter in to
new Orbit (#Fibonacci extension6.857%(4491)
Further Fibonacci extension projection ploted on chart.
Long term perspective.
#Probability https://t.co/fPSLKLDxln
#JUBLFOOD -3940
— Waves_Perception(Dinesh Patel) \u092e\u0948\u0902Schedule Tribes) (@idineshptl) August 17, 2021
Moving higher towards objective
6.857%(4491)#Probability https://t.co/oKppKL59mG
More from Waves_Perception(Dinesh Patel) मैंSchedule Tribes)

More from Jublfood


You May Also Like


Curated the best tweets from the best traders who are exceptional at managing strangles.
• Positional Strangles
• Intraday Strangles
• Position Sizing
• How to do Adjustments
• Plenty of Examples
• When to avoid
• Exit Criteria
How to sell Strangles in weekly expiry as explained by boss himself. @Mitesh_Engr
• When to sell
• How to do Adjustments
• Exit
1. Let's start option selling learning.
— Mitesh Patel (@Mitesh_Engr) February 10, 2019
Strangle selling. ( I am doing mostly in weekly Bank Nifty)
When to sell? When VIX is below 15
Assume spot is at 27500
Sell 27100 PE & 27900 CE
say premium for both 50-50
If bank nifty will move in narrow range u will get profit from both.
Beautiful explanation on positional option selling by @Mitesh_Engr
Sir on how to sell low premium strangles yourself without paying anyone. This is a free mini course in
Few are selling 20-25 Rs positional option selling course.
— Mitesh Patel (@Mitesh_Engr) November 3, 2019
Nothing big deal in that.
For selling weekly option just identify last week low and high.
Now from that low and high keep 1-1.5% distance from strike.
And sell option on both side.
1/n
1st Live example of managing a strangle by Mitesh Sir. @Mitesh_Engr
• Sold Strangles 20% cap used
• Added 20% cap more when in profit
• Booked profitable leg and rolled up
• Kept rolling up profitable leg
• Booked loss in calls
• Sold only
Sold 29200 put and 30500 call
— Mitesh Patel (@Mitesh_Engr) April 12, 2019
Used 20% capital@44 each
2nd example by @Mitesh_Engr Sir on converting a directional trade into strangles. Option Sellers can use this for consistent profit.
• Identified a reversal and sold puts
• Puts decayed a lot
• When achieved 2% profit through puts then sold
Already giving more than 2% return in a week. Now I will prefer to sell 32500 call at 74 to make it strangle in equal ratio.
— Mitesh Patel (@Mitesh_Engr) February 7, 2020
To all. This is free learning for you. How to play option to make consistent return.
Stay tuned and learn it here free of cost. https://t.co/7J7LC86oW0