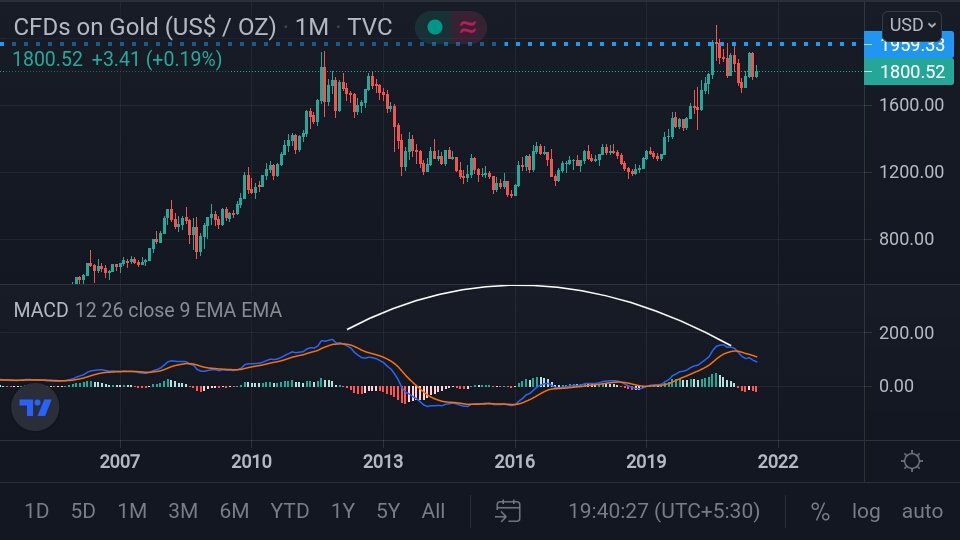
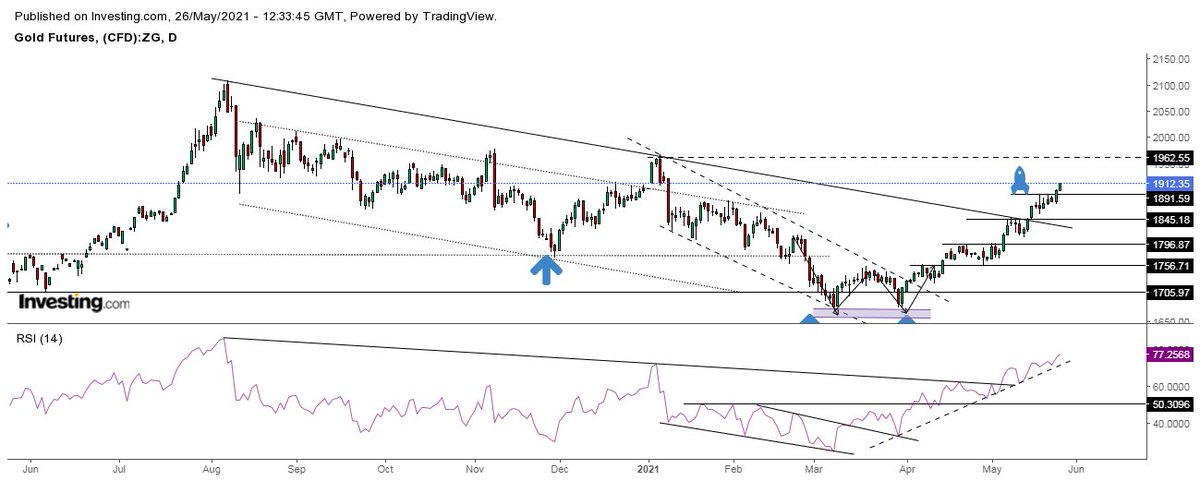
#GOLD$1800
Monthly chart
Opportunity after decade ?
#MACD
#Probability
#Observation
More from MaRkET WaVES (DINESH PATEL ) Stock Market FARMER

More from Gold


You May Also Like


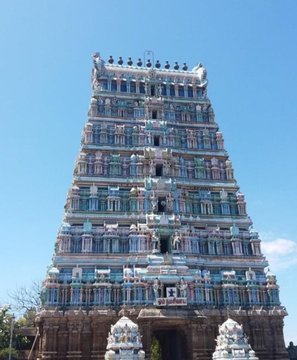
Margatha Natarajar murthi - Uthirakosamangai temple near Ramanathapuram,TN
#ArudraDarisanam
Unique Natarajar made of emerlad is abt 6 feet tall.
It is always covered with sandal paste.Only on Thriuvadhirai Star in month Margazhi-Nataraja can be worshipped without sandal paste.
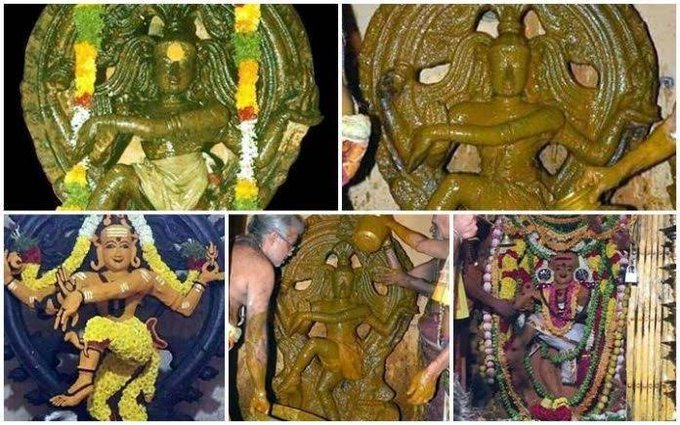
After removing the sandal paste,day long rituals & various abhishekam will be https://t.co/e1Ye8DrNWb day Maragatha Nataraja sannandhi will be closed after anointing the murthi with fresh sandal paste.Maragatha Natarajar is covered with sandal paste throughout the year
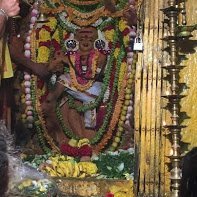
as Emerald has scientific property of its molecules getting disturbed when exposed to light/water/sound.This is an ancient Shiva temple considered to be 3000 years old -believed to be where Bhagwan Shiva gave Veda gyaana to Parvati Devi.This temple has some stunning sculptures.
#ArudraDarisanam
Unique Natarajar made of emerlad is abt 6 feet tall.
It is always covered with sandal paste.Only on Thriuvadhirai Star in month Margazhi-Nataraja can be worshipped without sandal paste.
After removing the sandal paste,day long rituals & various abhishekam will be https://t.co/e1Ye8DrNWb day Maragatha Nataraja sannandhi will be closed after anointing the murthi with fresh sandal paste.Maragatha Natarajar is covered with sandal paste throughout the year
as Emerald has scientific property of its molecules getting disturbed when exposed to light/water/sound.This is an ancient Shiva temple considered to be 3000 years old -believed to be where Bhagwan Shiva gave Veda gyaana to Parvati Devi.This temple has some stunning sculptures.

I’m torn on how to approach the idea of luck. I’m the first to admit that I am one of the luckiest people on the planet. To be born into a prosperous American family in 1960 with smart parents is to start life on third base. The odds against my very existence are astronomical.
I’ve always felt that the luckiest people I know had a talent for recognizing circumstances, not of their own making, that were conducive to a favorable outcome and their ability to quickly take advantage of them.
In other words, dumb luck was just that, it required no awareness on the person’s part, whereas “smart” luck involved awareness followed by action before the circumstances changed.
So, was I “lucky” to be born when I was—nothing I had any control over—and that I came of age just as huge databases and computers were advancing to the point where I could use those tools to write “What Works on Wall Street?” Absolutely.
Was I lucky to start my stock market investments near the peak of interest rates which allowed me to spend the majority of my adult life in a falling rate environment? Yup.
Ironies of Luck https://t.co/5BPWGbAxFi
— Morgan Housel (@morganhousel) March 14, 2018
"Luck is the flip side of risk. They are mirrored cousins, driven by the same thing: You are one person in a 7 billion player game, and the accidental impact of other people\u2019s actions can be more consequential than your own."
I’ve always felt that the luckiest people I know had a talent for recognizing circumstances, not of their own making, that were conducive to a favorable outcome and their ability to quickly take advantage of them.
In other words, dumb luck was just that, it required no awareness on the person’s part, whereas “smart” luck involved awareness followed by action before the circumstances changed.
So, was I “lucky” to be born when I was—nothing I had any control over—and that I came of age just as huge databases and computers were advancing to the point where I could use those tools to write “What Works on Wall Street?” Absolutely.
Was I lucky to start my stock market investments near the peak of interest rates which allowed me to spend the majority of my adult life in a falling rate environment? Yup.