
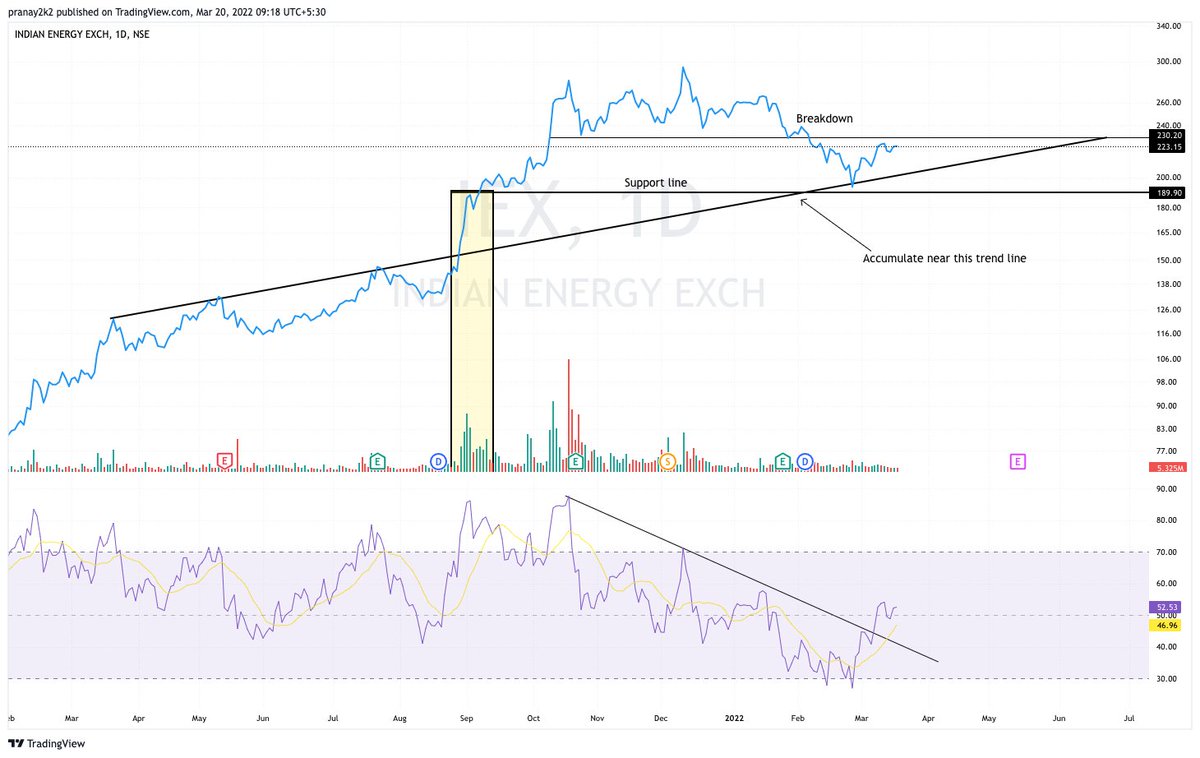
IEX - Added more in investment portfolio today. Perfect bounce back from the support. https://t.co/pACw24we1d
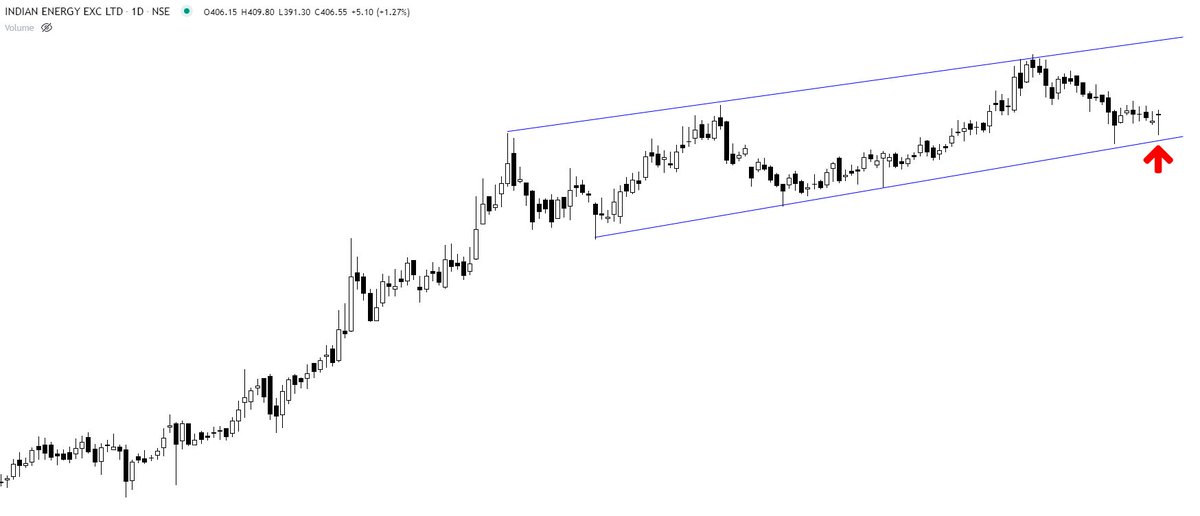
IEX Indian Energy Exchange - \u2b55\ufe0f\u2b55\ufe0f
— The_Chartist \U0001f4c8 (@nison_steve) July 20, 2021
although a must-have portfolio stock. Faced resistance right at the upper channel boundary. Volumes high. Any retracement back to the lower boundary will be an opportunity to accumulate. https://t.co/5uDsUXsbPP pic.twitter.com/Y6ZIXiwWUq
More from The_Chartist 📈
It is important to analyse the strength of the breakout. If the price does not continues the move in 1 or 2 sessions and candles show long upper wicks, it is better to bring the SL closer. Distribution sign.
Will be helpful in next breakouts. https://t.co/AtZOj4bKeT
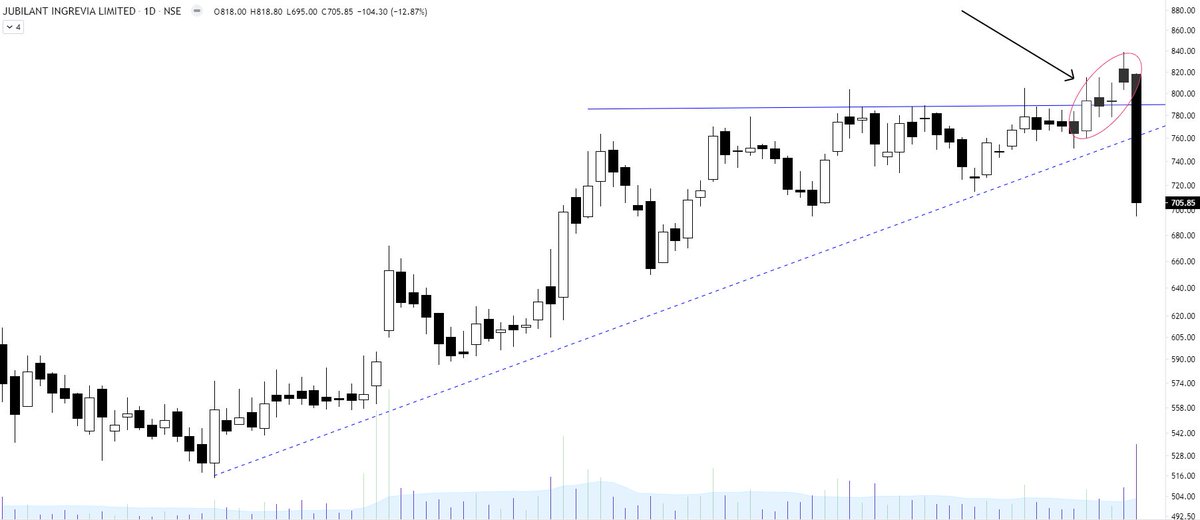
Learning: Strong breakout
— The_Chartist \U0001f4c8 (@nison_steve) July 2, 2021
1. Breakout candle will have no upper shadow or extremely less compared to the body
2. Volumes will be high (to avoid retailers to enter & also big hand absorbing all the selling)
3. Pullbacks will be rare/very less
4. Happens after a long consolidation pic.twitter.com/YTHDOnEdxo
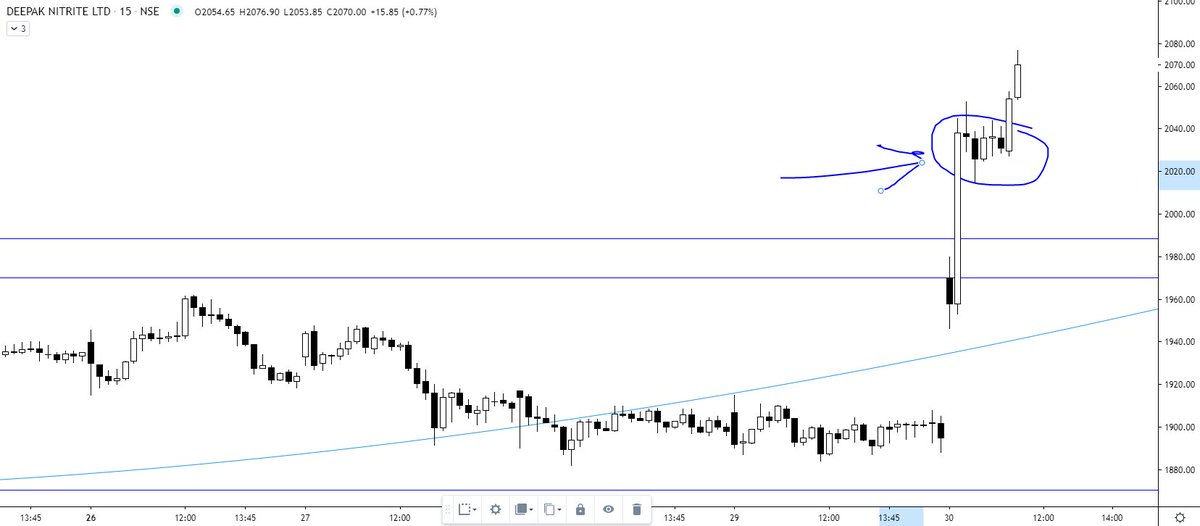
Explained you same concept with Elxsi. The real test of a strong Breakout is that the big hand will not give you another chance to buy the share at the breakout level. They will absorb all the selling of weak hands. I mean "STRONG breakout". https://t.co/7fxFqGQl3p
Tata Elxsi ---
— Steve Nison (@nison_steve) June 30, 2021
In the last 10 minutes, all the selling was absorbed despite intraday positions being squared off (if not converted). will wait for the EOD data. However, the chart structure is extremely strong. https://t.co/pci7GCDBEO pic.twitter.com/1NBD9V3mKc
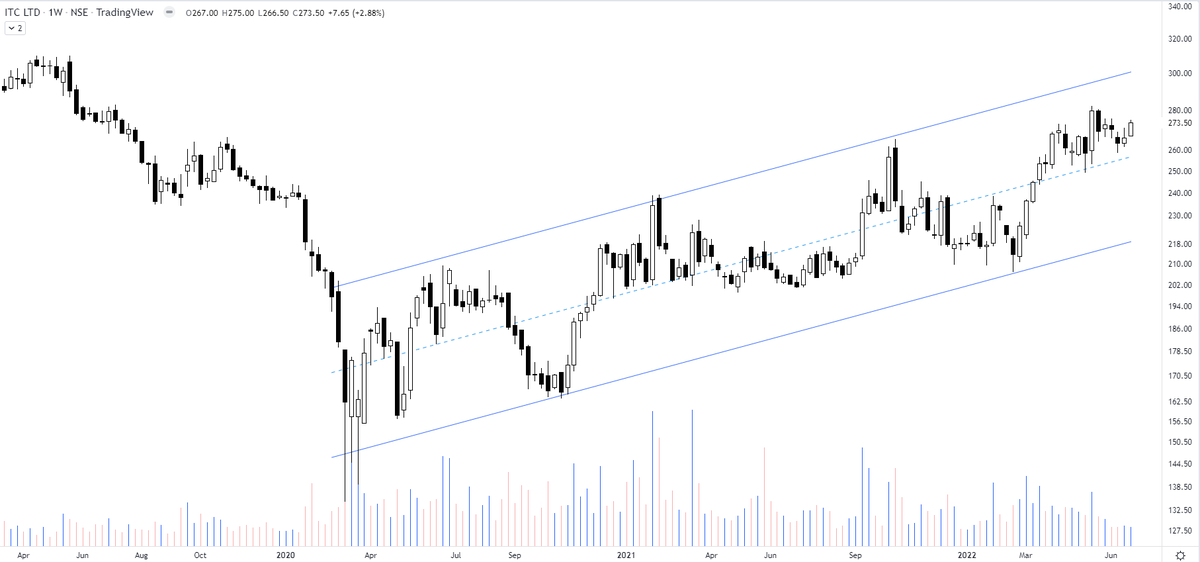
ITC - how beautifully the price patterns work. All of a sudden an increased momentum right from the support of the channel boundary. Has a minor resistance to nail down in the middle.
— The_Chartist \U0001f4c8 (@charts_zone) March 18, 2022
Anyone observing it would have gone aggressive at lower end for a swing move pic.twitter.com/YqxkdFlJXQ
Fresh case - RUPA https://t.co/nqq5nI1wLU
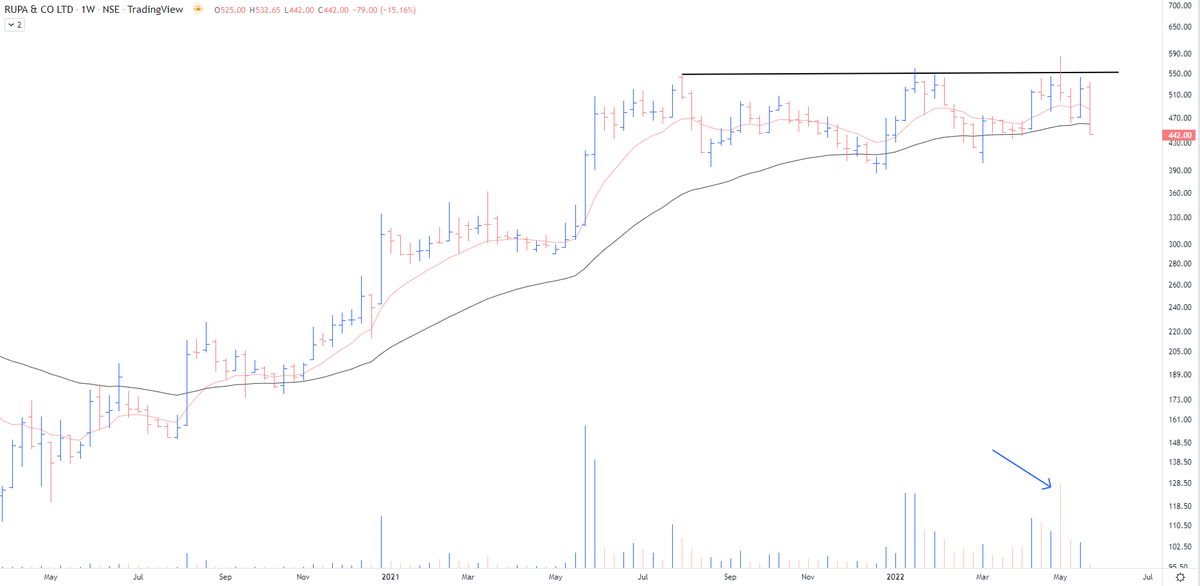
Respect your stop losses in the stocks that have gone down today with heavy volumes even on a strong day.
— The_Chartist \U0001f4c8 (@charts_zone) March 17, 2022
VTL pic.twitter.com/3pJ9XngCDL
More from Iex


You May Also Like


Unfortunately the "This work includes the identification of viral sequences in bat samples, and has resulted in the isolation of three bat SARS-related coronaviruses that are now used as reagents to test therapeutics and vaccines." were BEFORE the

chimeric infectious clone grants were there.https://t.co/DAArwFkz6v is in 2017, Rs4231.
https://t.co/UgXygDjYbW is in 2016, RsSHC014 and RsWIV16.
https://t.co/krO69CsJ94 is in 2013, RsWIV1. notice that this is before the beginning of the project
starting in 2016. Also remember that they told about only 3 isolates/live viruses. RsSHC014 is a live infectious clone that is just as alive as those other "Isolates".
P.D. somehow is able to use funds that he have yet recieved yet, and send results and sequences from late 2019 back in time into 2015,2013 and 2016!
https://t.co/4wC7k1Lh54 Ref 3: Why ALL your pangolin samples were PCR negative? to avoid deep sequencing and accidentally reveal Paguma Larvata and Oryctolagus Cuniculus?


This New York Times feature shows China with a Gini Index of less than 30, which would make it more equal than Canada, France, or the Netherlands. https://t.co/g3Sv6DZTDE
That's weird. Income inequality in China is legendary.
Let's check this number.
2/The New York Times cites the World Bank's recent report, "Fair Progress? Economic Mobility across Generations Around the World".
The report is available here:
3/The World Bank report has a graph in which it appears to show the same value for China's Gini - under 0.3.
The graph cites the World Development Indicators as its source for the income inequality data.

4/The World Development Indicators are available at the World Bank's website.
Here's the Gini index: https://t.co/MvylQzpX6A
It looks as if the latest estimate for China's Gini is 42.2.
That estimate is from 2012.
5/A Gini of 42.2 would put China in the same neighborhood as the U.S., whose Gini was estimated at 41 in 2013.
I can't find the <30 number anywhere. The only other estimate in the tables for China is from 2008, when it was estimated at 42.8.