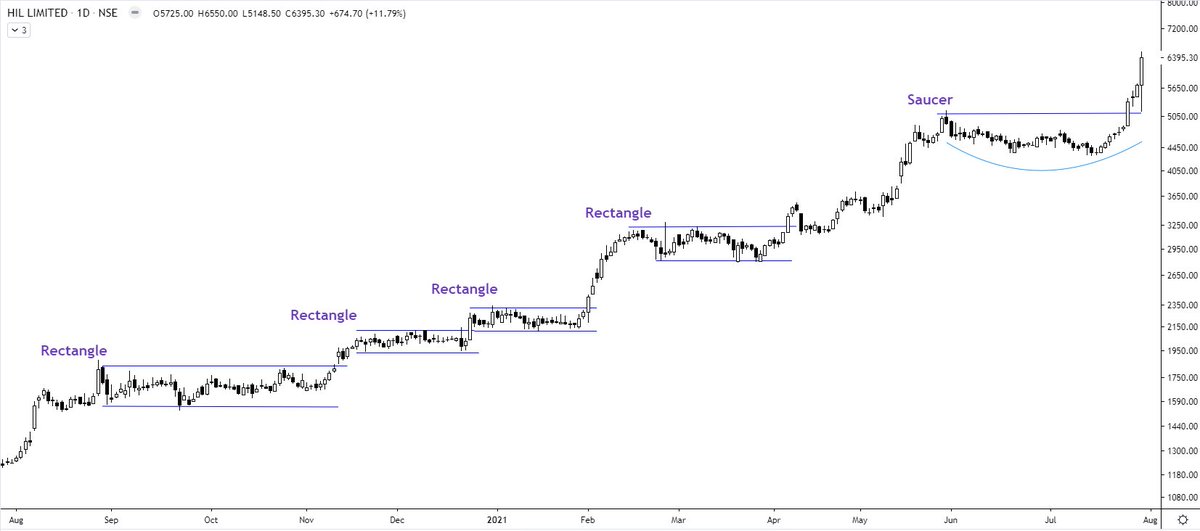
HIL Limited - how many times it gave you the opportunity screaming to be bought. And every time you must have ignored it because you missed the initial few points at the first breakout level?
Try to catch the strongest counters at the next consolidation with strict SL.
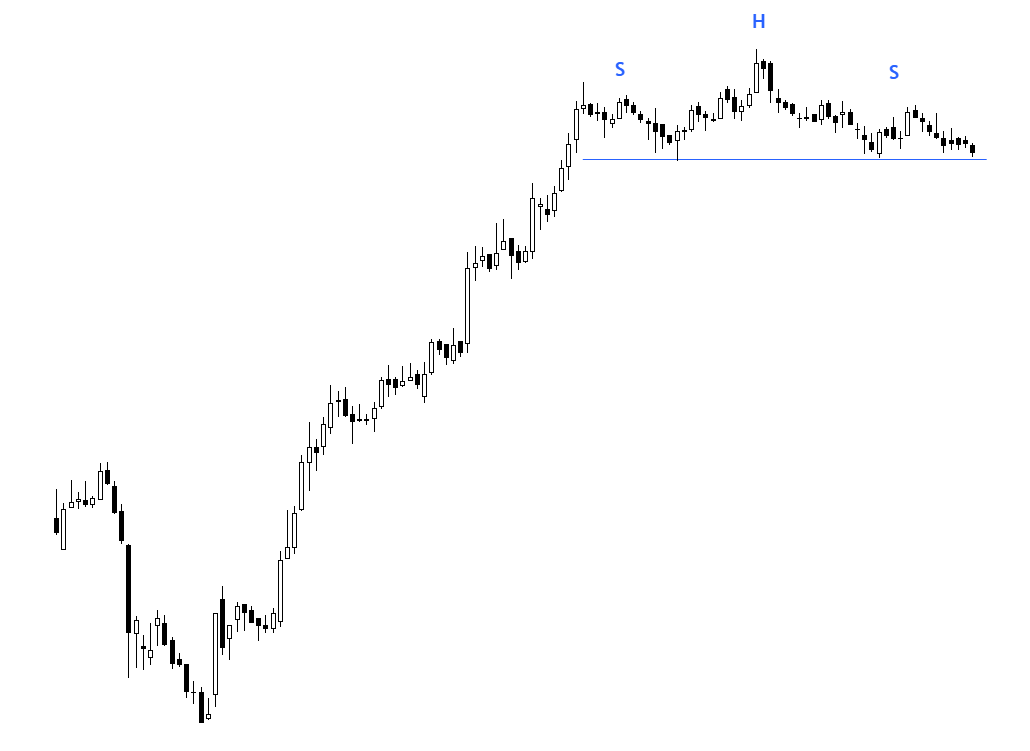
More from Steve Nison
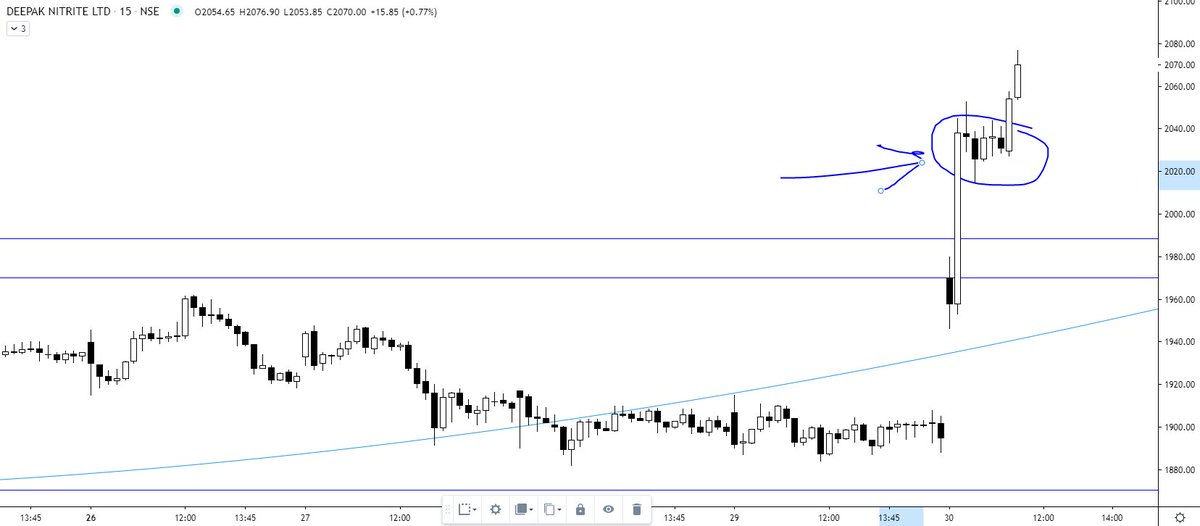
Deepak nitrite
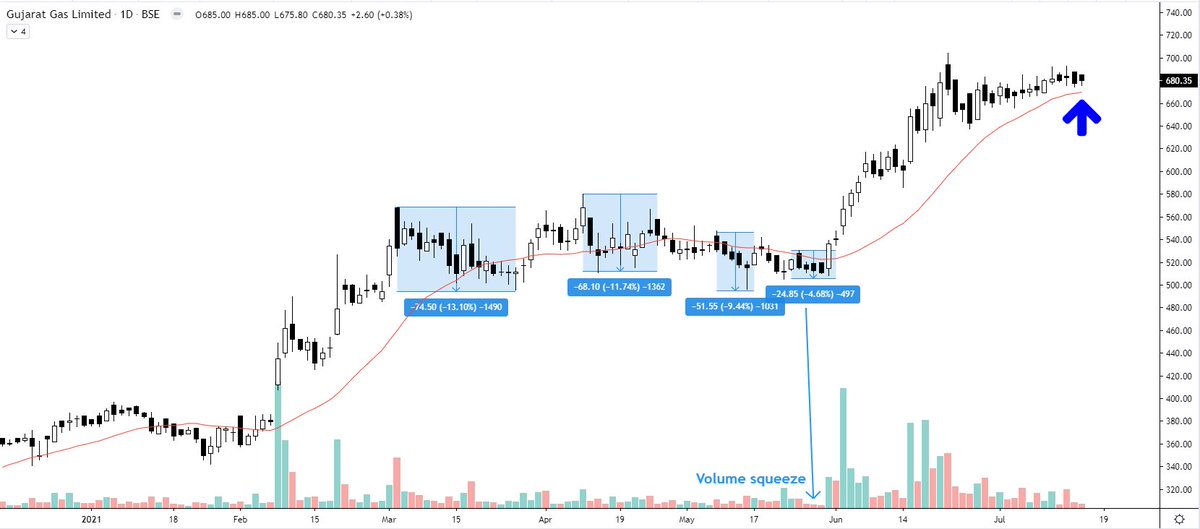
Explained you same concept with Elxsi. The real test of a strong Breakout is that the big hand will not give you another chance to buy the share at the breakout level. They will absorb all the selling of weak hands. I mean "STRONG breakout". https://t.co/7fxFqGQl3p
Explained you same concept with Elxsi. The real test of a strong Breakout is that the big hand will not give you another chance to buy the share at the breakout level. They will absorb all the selling of weak hands. I mean "STRONG breakout". https://t.co/7fxFqGQl3p
Tata Elxsi ---
— Steve Nison (@nison_steve) June 30, 2021
In the last 10 minutes, all the selling was absorbed despite intraday positions being squared off (if not converted). will wait for the EOD data. However, the chart structure is extremely strong. https://t.co/pci7GCDBEO pic.twitter.com/1NBD9V3mKc
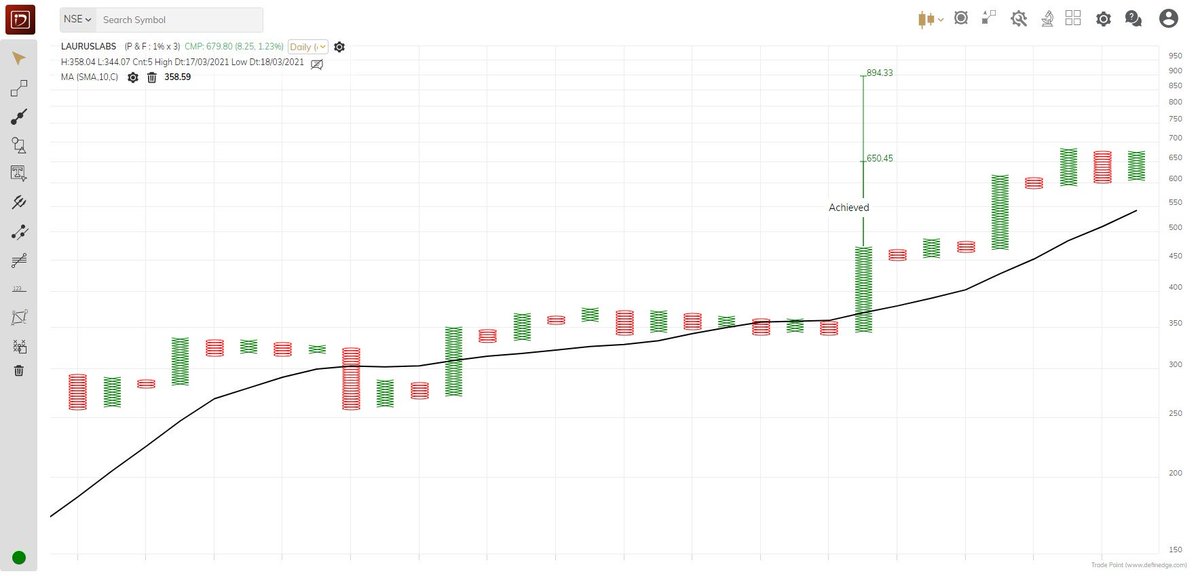
Laurus Labs - Double top buy will be activated above closing of 690. Target still active: 895 (1%*3 box size and reversal)
✅✅ https://t.co/MtJOLfpzYj
✅✅ https://t.co/MtJOLfpzYj
Laurus Labs - I am waiting till 3:15 PM to get confirmation of closing above 700 to add more of it in my portfolio. \u2705\u2705 pic.twitter.com/UxZCuxhuIX
— Steve Nison (@nison_steve) August 9, 2021
May please read the attached tweet once again for a key LEARNING
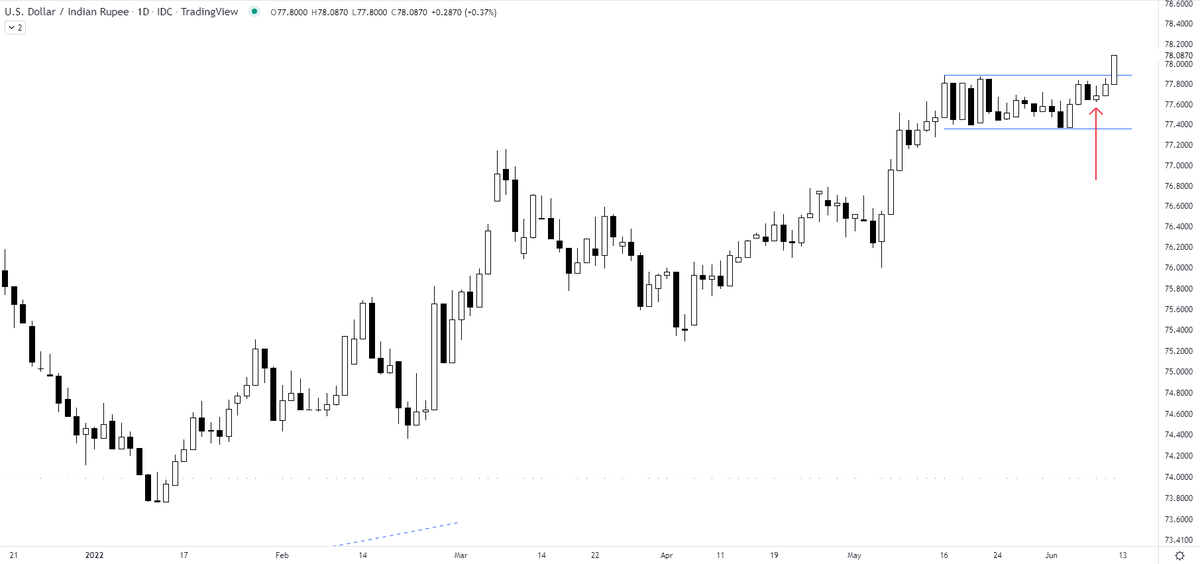
USDINR - a breakout that will not bode well for the equities
78+ https://t.co/AWqZxF5B1L
USDINR - a breakout that will not bode well for the equities
78+ https://t.co/AWqZxF5B1L
Can you anticipate a breakout? Yes
— The_Chartist \U0001f4c8 (@charts_zone) June 10, 2022
the attached tweet.
now the chart is for USDINR https://t.co/Vb2wKaCvTB pic.twitter.com/INo0GC4fGY