
It's been 13 months since my craniocervical fusion surgery and 7 months since my tethered cord surgery. My diagnoses were craniocervical instability, tethered cord, ME/CFS, MCAS, POTS, and mold illness (which may or may be fully explained by MCAS). 1/n
More from Health


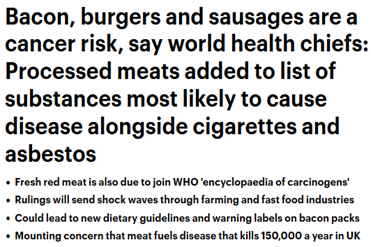
I applaud the #EUCancerPlan *BUT* caution: putting #meat 🥩 (a nourishing, evolutionary food) in the same box as 🚬 to solve a contemporary health challenge, would be basing policy on assumptions rather than robust data.
#FollowTheScience yes, but not just part of it!
THREAD👇
1/ Granted, some studies have pointed to ASSOCIATIONS of HIGH intake of red & processed meats with (slightly!) increased colorectal cancer incidence. Also, @WHO/IARC is often mentioned in support (usually hyperbolically so).
But, let’s have a closer look at all this! 🔍
2/ First, meat being “associated” with cancer is very different from stating that meat CAUSES cancer.
Unwarranted use of causal language is widespread in nutritional sciences, posing a systemic problem & undermining credibility.
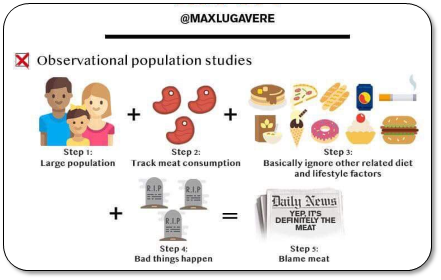
3/ That’s because observational data are CONFOUNDED (even after statistical adjustment).
Healthy user bias is a major problem. Healthy middle classes are TOLD to eat less red meat (due to historical rather than rational reasons, cf link). So, they
4/ What’s captured here is sociology, not physiology.
Health-focused Westerners eat less red meat, whereas those who don’t adhere to dietary advice tend to have unhealthier lifestyles.
That tells us very little about meat AS SUCH being responsible for disease.
#FollowTheScience yes, but not just part of it!
THREAD👇
\U0001f534LIVE \U0001f4c5Today \u23f012:00 CET
— EU_HEALTH - #EUCancerPlan (@EU_Health) February 3, 2021
We are presenting today the #EUCancerPlan as part of a strong \U0001f1ea\U0001f1fa#HealthUnion
Follow the presentation live here: https://t.co/Cr8ATvzNkg#WorldCancerDay pic.twitter.com/zdByuklWV6
1/ Granted, some studies have pointed to ASSOCIATIONS of HIGH intake of red & processed meats with (slightly!) increased colorectal cancer incidence. Also, @WHO/IARC is often mentioned in support (usually hyperbolically so).
But, let’s have a closer look at all this! 🔍
2/ First, meat being “associated” with cancer is very different from stating that meat CAUSES cancer.
Unwarranted use of causal language is widespread in nutritional sciences, posing a systemic problem & undermining credibility.
3/ That’s because observational data are CONFOUNDED (even after statistical adjustment).
Healthy user bias is a major problem. Healthy middle classes are TOLD to eat less red meat (due to historical rather than rational reasons, cf link). So, they
4/ What’s captured here is sociology, not physiology.
Health-focused Westerners eat less red meat, whereas those who don’t adhere to dietary advice tend to have unhealthier lifestyles.
That tells us very little about meat AS SUCH being responsible for disease.
You May Also Like


On the occasion of youtube 20k and Twitter 70k members
A small tribute/gift to members
Screeners
technical screeners - intraday and positional both
before proceeding - i have helped you , can i ask you so that it can help someone else too
thank you
positional one
run - find #stock - draw chart - find levels
1- Stocks closing daily 2% up from 5 days
https://t.co/gTZrYY3Nht
2- Weekly breakout
https://t.co/1f4ahEolYB
3- Breakouts in short term
https://t.co/BI4h0CdgO2
4- Bullish from last 5
intraday screeners
5- 15 minute Stock Breakouts
https://t.co/9eAo82iuNv
6- Intraday Buying seen in the past 15 minutes
https://t.co/XqAJKhLB5G
7- Stocks trading near day's high on 5 min chart with volume BO intraday
https://t.co/flHmm6QXmo
Thank you


1/OK, data mystery time.
This New York Times feature shows China with a Gini Index of less than 30, which would make it more equal than Canada, France, or the Netherlands. https://t.co/g3Sv6DZTDE
That's weird. Income inequality in China is legendary.
Let's check this number.
2/The New York Times cites the World Bank's recent report, "Fair Progress? Economic Mobility across Generations Around the World".
The report is available here:
3/The World Bank report has a graph in which it appears to show the same value for China's Gini - under 0.3.
The graph cites the World Development Indicators as its source for the income inequality data.

4/The World Development Indicators are available at the World Bank's website.
Here's the Gini index: https://t.co/MvylQzpX6A
It looks as if the latest estimate for China's Gini is 42.2.
That estimate is from 2012.
5/A Gini of 42.2 would put China in the same neighborhood as the U.S., whose Gini was estimated at 41 in 2013.
I can't find the <30 number anywhere. The only other estimate in the tables for China is from 2008, when it was estimated at 42.8.
This New York Times feature shows China with a Gini Index of less than 30, which would make it more equal than Canada, France, or the Netherlands. https://t.co/g3Sv6DZTDE
That's weird. Income inequality in China is legendary.
Let's check this number.
2/The New York Times cites the World Bank's recent report, "Fair Progress? Economic Mobility across Generations Around the World".
The report is available here:
3/The World Bank report has a graph in which it appears to show the same value for China's Gini - under 0.3.
The graph cites the World Development Indicators as its source for the income inequality data.
4/The World Development Indicators are available at the World Bank's website.
Here's the Gini index: https://t.co/MvylQzpX6A
It looks as if the latest estimate for China's Gini is 42.2.
That estimate is from 2012.
5/A Gini of 42.2 would put China in the same neighborhood as the U.S., whose Gini was estimated at 41 in 2013.
I can't find the <30 number anywhere. The only other estimate in the tables for China is from 2008, when it was estimated at 42.8.