Schoen is pretending courtroom "due process" must be followed--after meeting with some of the jurors to plan strategy last night.
It's because Trumpists love attacking Senator Warren.
Gee, it's almost like he thinks Senator Warren is being impeached.
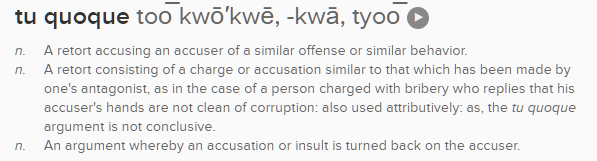
"You can't accuse ME of X, when YOU'VE done X!!"
This isn't a defense (even in the few cases when it's honest). It is neither a denial nor a justification. It's deflection, done when the accusation is true.
More from Government


They shouldn't be.
The pattern is:
GOP in power - GOP dictates policy
Dems in power - GOP dictates policy
The Dems shouldn't legislate toward the GOP.
The GOP doesn't represent its constituents.
The GOP can push it's agenda on its own time.
If Dems push an agenda that actually helps people, it'll also actually help the GOP constituency.
The GOP won't. So give them nothing.
The Dems should ignore the GOP just like the GOP ignores the Dems.
Make them pay for every moment of obstruction.
Just a hard press on legislation that is unassailable and shine a light on the GOP.
Constant. Relentless. Unyielding.
Shut them out and shut them down.
The GOP is not a legitimate political party. It is an anti-democratic, fascist criminal syndicate with no interest whatsoever in governance.
Nobody should give them the slightest bit of credit or legitimacy ever again.
Not a fucking ounce.
Nobody should engage them in legitimate debate in Congress.
They should be pariahs and treated as unserious occupants of Congress.
Because these people were totally ok with their colleagues being killed in furtherance of the destruction of the insitution.
The pattern is:
GOP in power - GOP dictates policy
Dems in power - GOP dictates policy
Soooooooo what\u2019s the problem. The statement I responded to read as it they haven\u2019t been trying to work together.. but they have so..?
— Othello (@BurberryKid11) February 2, 2021
The Dems shouldn't legislate toward the GOP.
The GOP doesn't represent its constituents.
The GOP can push it's agenda on its own time.
If Dems push an agenda that actually helps people, it'll also actually help the GOP constituency.
The GOP won't. So give them nothing.
The Dems should ignore the GOP just like the GOP ignores the Dems.
Make them pay for every moment of obstruction.
Just a hard press on legislation that is unassailable and shine a light on the GOP.
Constant. Relentless. Unyielding.
Shut them out and shut them down.
The GOP is not a legitimate political party. It is an anti-democratic, fascist criminal syndicate with no interest whatsoever in governance.
Nobody should give them the slightest bit of credit or legitimacy ever again.
Not a fucking ounce.
Nobody should engage them in legitimate debate in Congress.
They should be pariahs and treated as unserious occupants of Congress.
Because these people were totally ok with their colleagues being killed in furtherance of the destruction of the insitution.