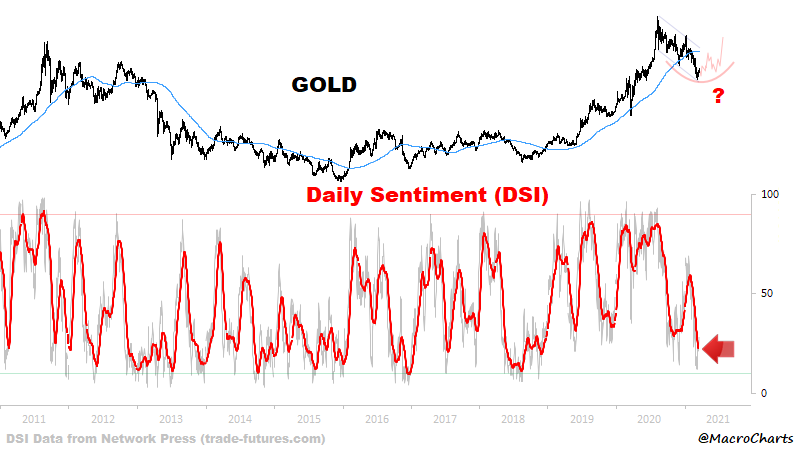
Gold Update https://t.co/RzHJLtKMmR
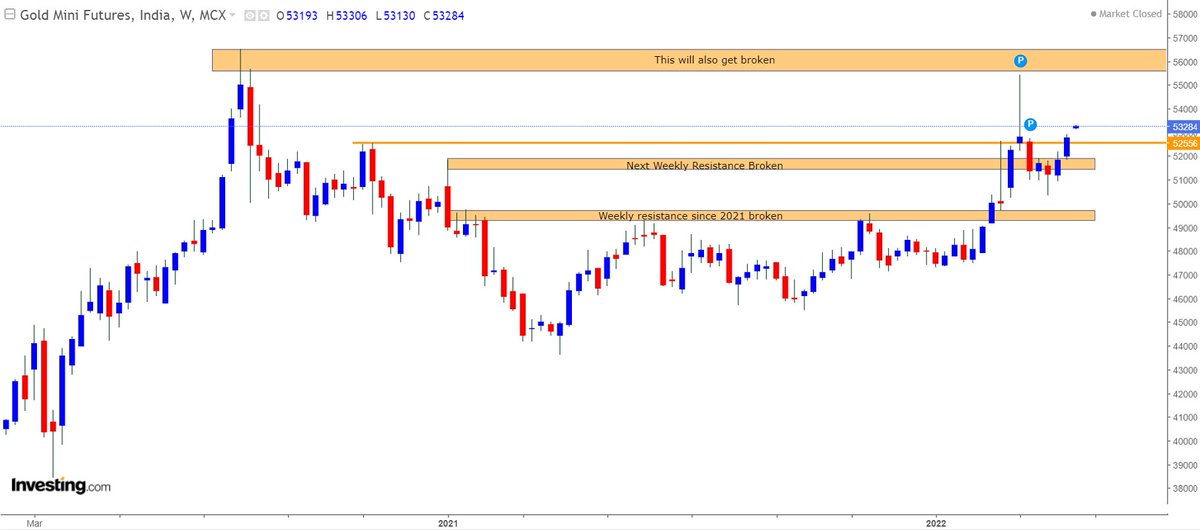
Gold again trying to clear the immediate resistance zone ! Retouch of ATH and making new high is pending....... pic.twitter.com/PLmPoB7EUO
— Professor (@DillikiBiili) April 12, 2022
More from Professor

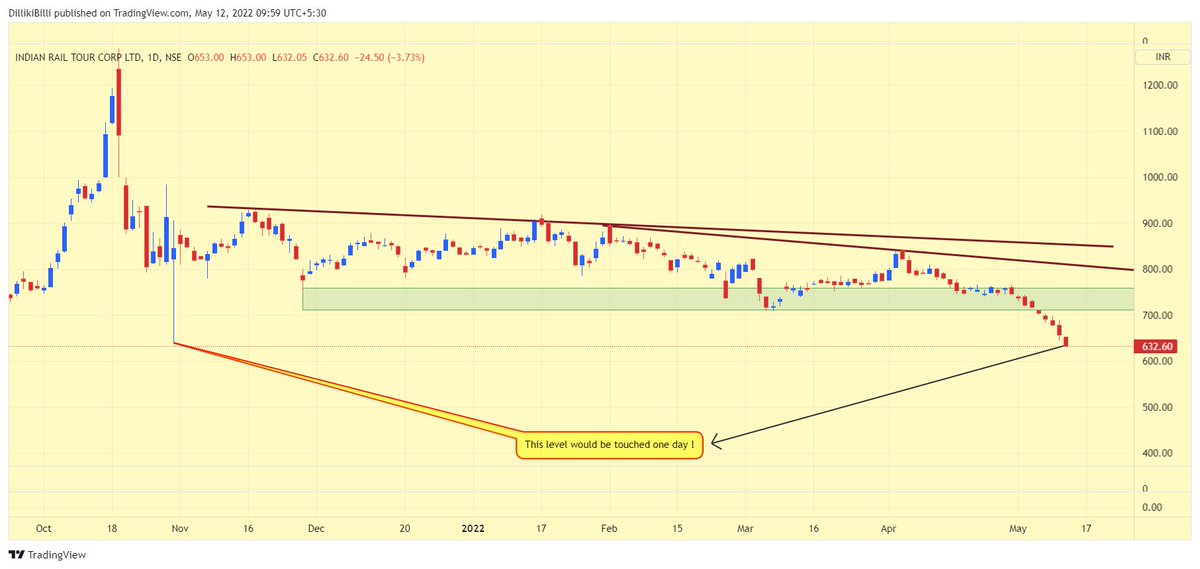
IRCTC below 640 today !
Have no intention to enjoy the misery of fellow market participants but 'Maine Bola Tha' !
#ProfGyan - If a freak low gets made some day, Stocks/Indices always try to visit it at least once (seekh lo, mere mentorship course ka launch kuch pukka nahi hai) https://t.co/3B6e2nMx0y
Have no intention to enjoy the misery of fellow market participants but 'Maine Bola Tha' !
#ProfGyan - If a freak low gets made some day, Stocks/Indices always try to visit it at least once (seekh lo, mere mentorship course ka launch kuch pukka nahi hai) https://t.co/3B6e2nMx0y
Two prophecies about IRCTC:
— Professor (@DillikiBiili) May 1, 2022
1. It would touch 640 someday
2. It would get expelled from F&O https://t.co/qJ04hG0qFH pic.twitter.com/TPUBSQFW1y
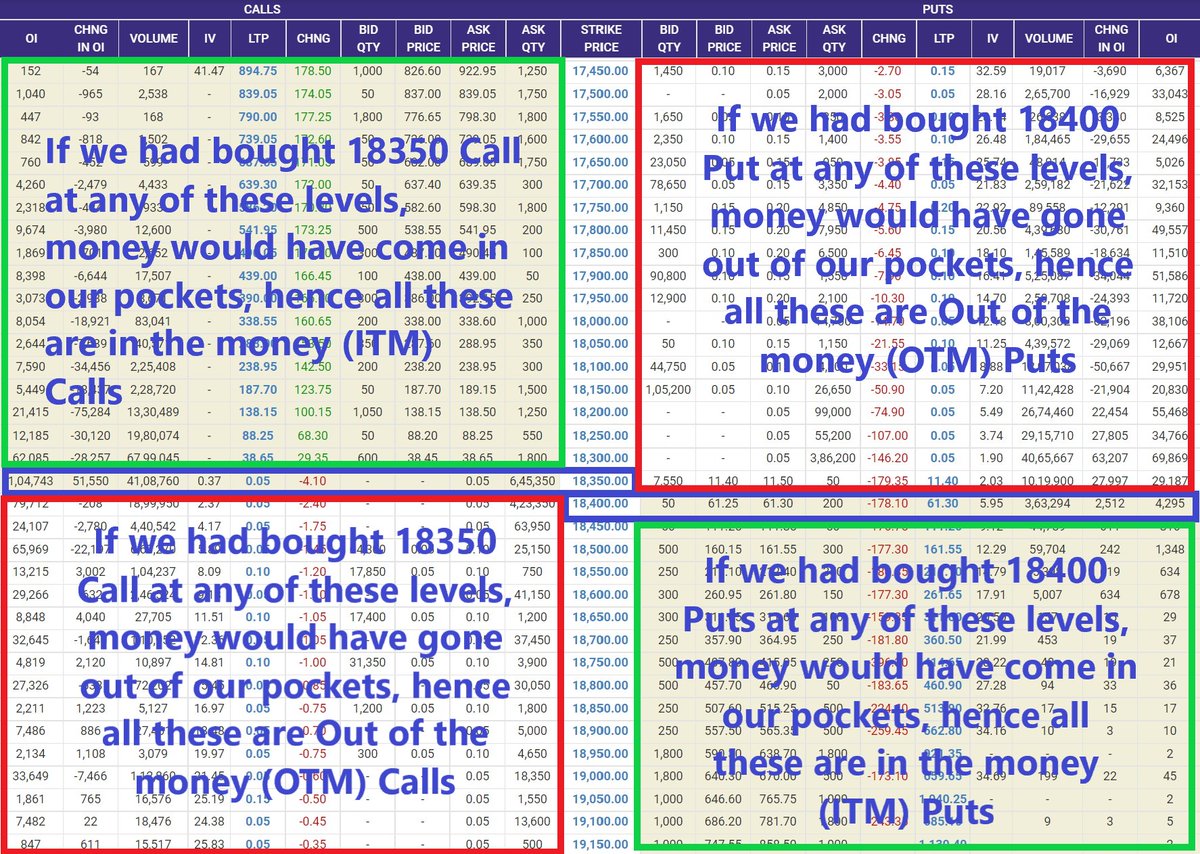
OI Data reading seekh lo:
See Large OIl buildup kin strikes par hai and in between strikes data kaise move ho raha hai.
Thumb Rule:
Calls Reduction + Puts addition = Upthrust
Calls Addition + Put Reduction = Down move
Higher the Delta OI velocity, faster is the move.
See Large OIl buildup kin strikes par hai and in between strikes data kaise move ho raha hai.
Thumb Rule:
Calls Reduction + Puts addition = Upthrust
Calls Addition + Put Reduction = Down move
Higher the Delta OI velocity, faster is the move.
For Nifty Intraday Traders: As of now, this seems to be a buy on dip market and looks like there won't be any juicy trades on short side. Will update if data changes. https://t.co/PCIyyPld4A pic.twitter.com/ES3o4z60rY
— Professor (@DillikiBiili) March 11, 2022
More from Gold


90% of my savings were in equity, debt was never attractive! Last few months have taught me the imp of diversification!
Gold - through SGBs was my move on diversifying! Holder since Jan'20 - so far so good!
A🧵on talk given by @PositiveGamma on Investing in Gold!
(1/16)

Link to the here - https://t.co/NxEkVKZi2H
MMTC PAMP is where Krishna worked before Setu and he was also responsible for launching Digi Gold at PayTM!
1) Why Gold?
1.1 Diversification - Volatility & Returns not tied to market conditions - diff. from financial assets.
(2/16)
1.2 Safe Haven - High value asset, easy to transport! Large value - limited space. Liquid and easy to convert to cash across the world.
1.3 Hedge against inflation and currency depreciation! (Depreciation of Rupee is a major factor behind Gold returns in India)
(3/16)
1.4 Upside in Tail Risk - Confidence in currencies & financial systems is low, gold can see upside in scenarios like this!
1.5 Upside on Demand/Supply - Constant Demand - Supply is stable!
2) Gold - Indian Context - Better returns compared to other asset classes...
(4/16)
... specially in the last 2-3 years. Gold has done well both in low inflation & high inflation returns. So both real (ex. inflation) & nominal returns have been good!
3) How much to Allocate?
3.1 Diversification/Inflation Hedge - 10-20%
3.2 Tail Risk/Safe Haven - 5-20%
(5/16)
Gold - through SGBs was my move on diversifying! Holder since Jan'20 - so far so good!
A🧵on talk given by @PositiveGamma on Investing in Gold!
(1/16)
Link to the here - https://t.co/NxEkVKZi2H
MMTC PAMP is where Krishna worked before Setu and he was also responsible for launching Digi Gold at PayTM!
1) Why Gold?
1.1 Diversification - Volatility & Returns not tied to market conditions - diff. from financial assets.
(2/16)
1.2 Safe Haven - High value asset, easy to transport! Large value - limited space. Liquid and easy to convert to cash across the world.
1.3 Hedge against inflation and currency depreciation! (Depreciation of Rupee is a major factor behind Gold returns in India)
(3/16)
1.4 Upside in Tail Risk - Confidence in currencies & financial systems is low, gold can see upside in scenarios like this!
1.5 Upside on Demand/Supply - Constant Demand - Supply is stable!
2) Gold - Indian Context - Better returns compared to other asset classes...
(4/16)
... specially in the last 2-3 years. Gold has done well both in low inflation & high inflation returns. So both real (ex. inflation) & nominal returns have been good!
3) How much to Allocate?
3.1 Diversification/Inflation Hedge - 10-20%
3.2 Tail Risk/Safe Haven - 5-20%
(5/16)