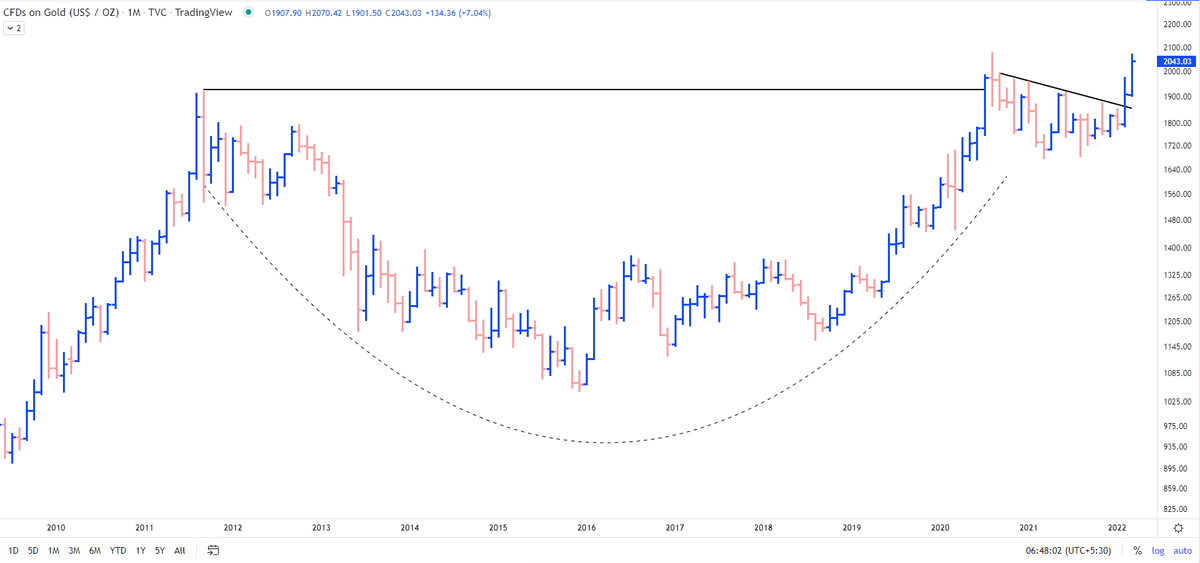
#GOLD $1877
Has already broken out of the falling trend and seems to have started a fresh leg up towards existing highs and possibly even a new high as well!
Weekly chart so this would move up gradually. Support and resistances marked on the
More from Nishant Kumar
More from Gold


What my simple analysis showed was the decadal breakout in making in #Gold along with the outperformance over S&P500 #SPX
Result?
1850$ to 2070$
Updated chart https://t.co/l6pEGD7r6D
Result?
1850$ to 2070$
Updated chart https://t.co/l6pEGD7r6D
Most interesting chart:
— The_Chartist \U0001f4c8 (@charts_zone) February 12, 2022
Orange line = Gold
Blue Curve = Gold/S&P 500
Previously the ratio crossed 50 days MA in Feb' 20 with Gold giving a breakout on the charts. The previous cross of 50 days MA didn't result in gold breaking out. pic.twitter.com/HRG1fvsILp


You May Also Like


✨📱 iOS 12.1 📱✨
🗓 Release date: October 30, 2018
📝 New Emojis: 158
https://t.co/bx8XjhiCiB
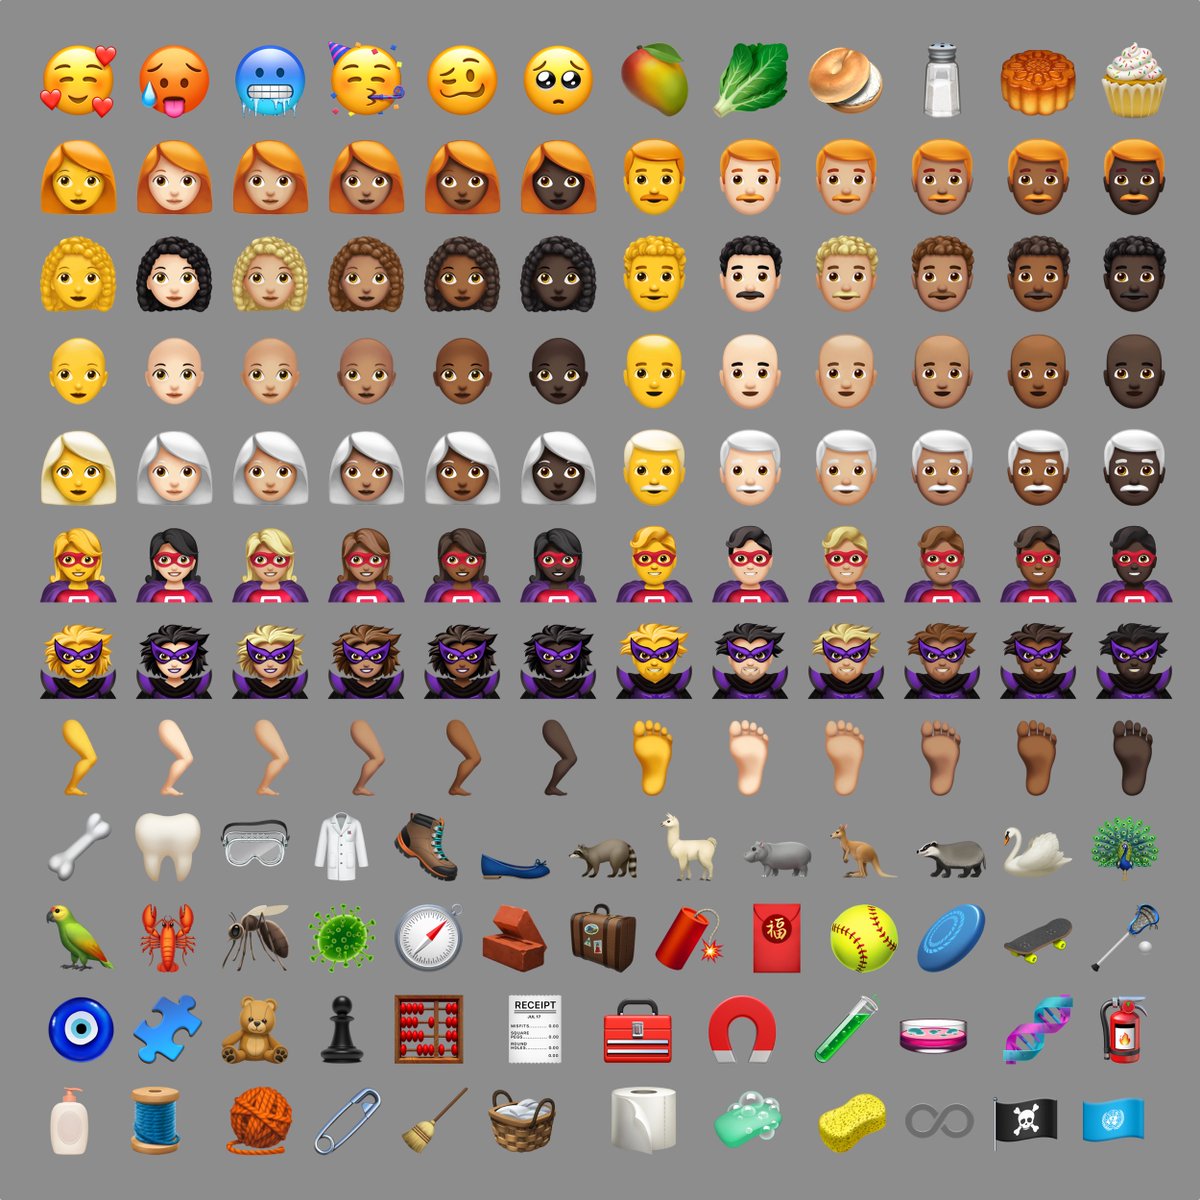
New in iOS 12.1: 🥰 Smiling Face With 3 Hearts https://t.co/6eajdvueip

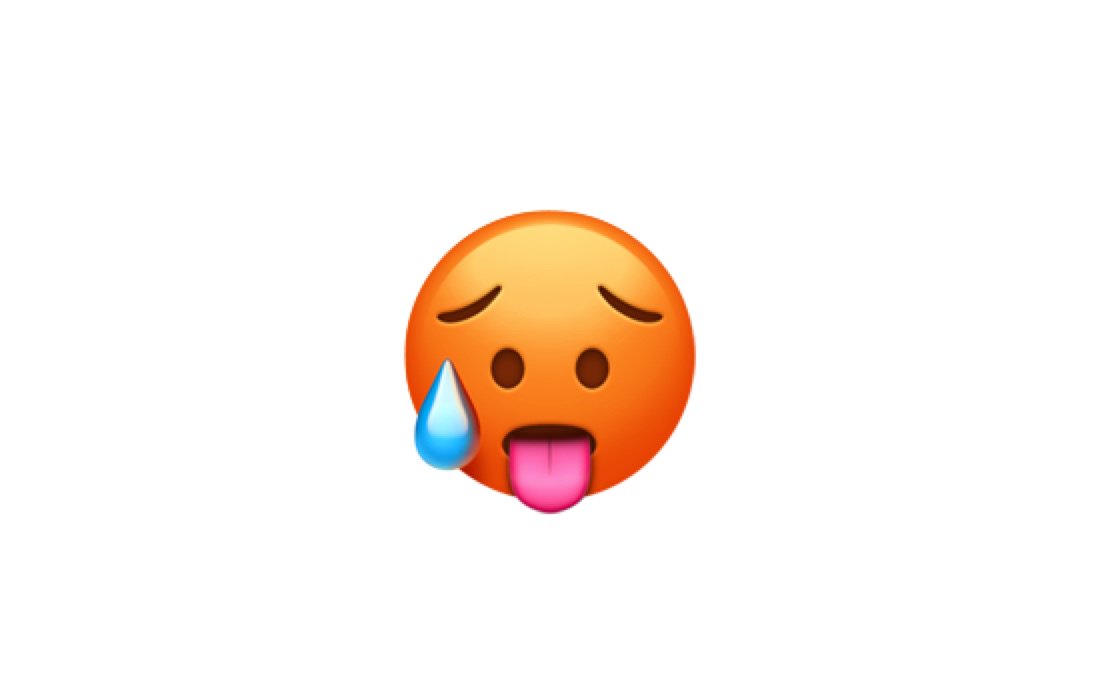
New in iOS 12.1: 🥵 Hot Face https://t.co/jhTv1elltB
New in iOS 12.1: 🥶 Cold Face https://t.co/EIjyl6yZrF

New in iOS 12.1: 🥳 Partying Face https://t.co/p8FDNEQ3LJ

🗓 Release date: October 30, 2018
📝 New Emojis: 158
https://t.co/bx8XjhiCiB
New in iOS 12.1: 🥰 Smiling Face With 3 Hearts https://t.co/6eajdvueip
New in iOS 12.1: 🥵 Hot Face https://t.co/jhTv1elltB
New in iOS 12.1: 🥶 Cold Face https://t.co/EIjyl6yZrF
New in iOS 12.1: 🥳 Partying Face https://t.co/p8FDNEQ3LJ