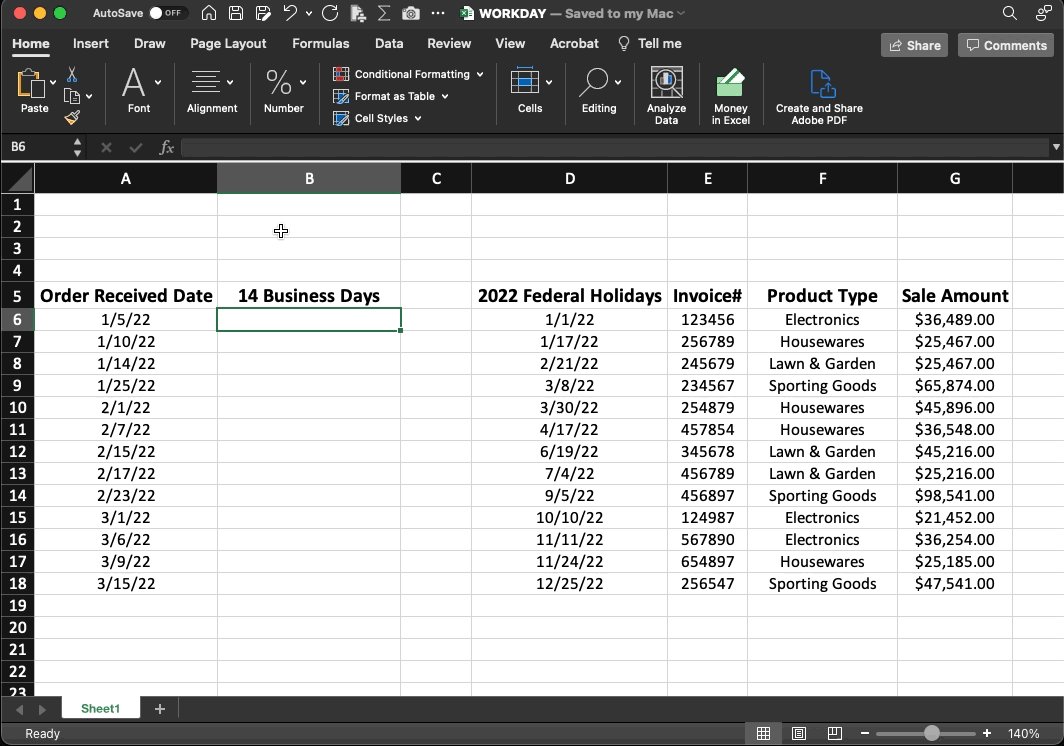
WORKDAY:
Customers need to know when the job will be done.
The Workday function allows you to easily calculate the time between your start date and a specified number of "business days" in the future.
Automatically exclude weekends & holidays of your choosing.
Like this:
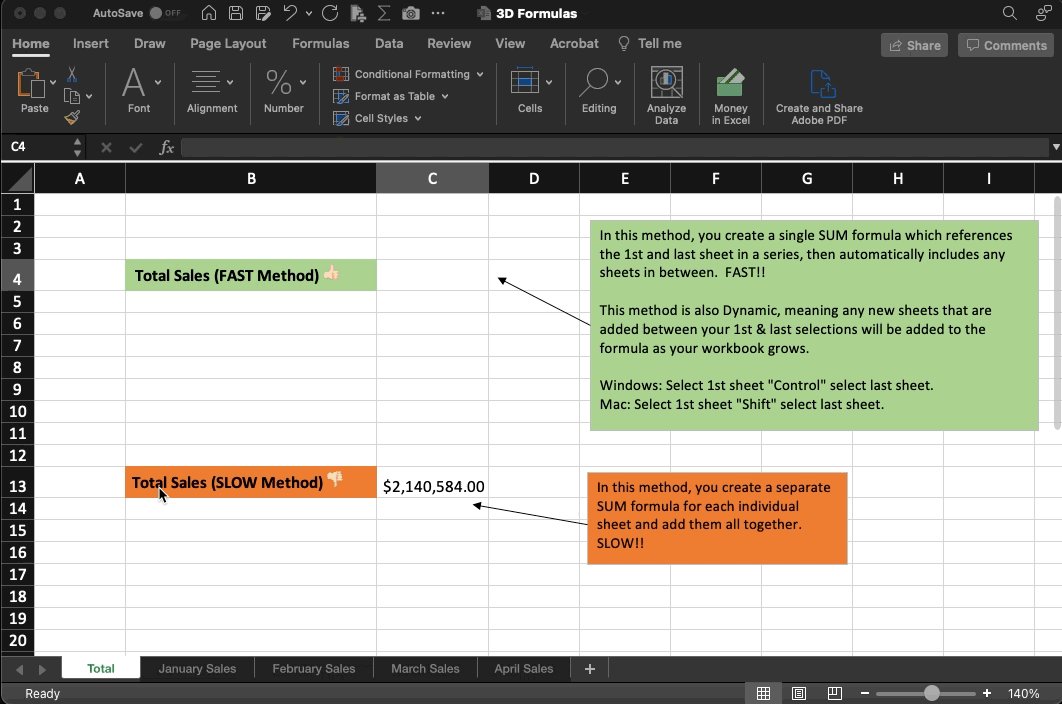
3D FORMULAS:
Let's say you want to add up the values in Column 'D' on 4 different sheets & show a single total.
Quit wasting time on SUM formulas that reference each sheet individually.
3D lets you select the 1st + last sheet in a series and dynamically include any in between.
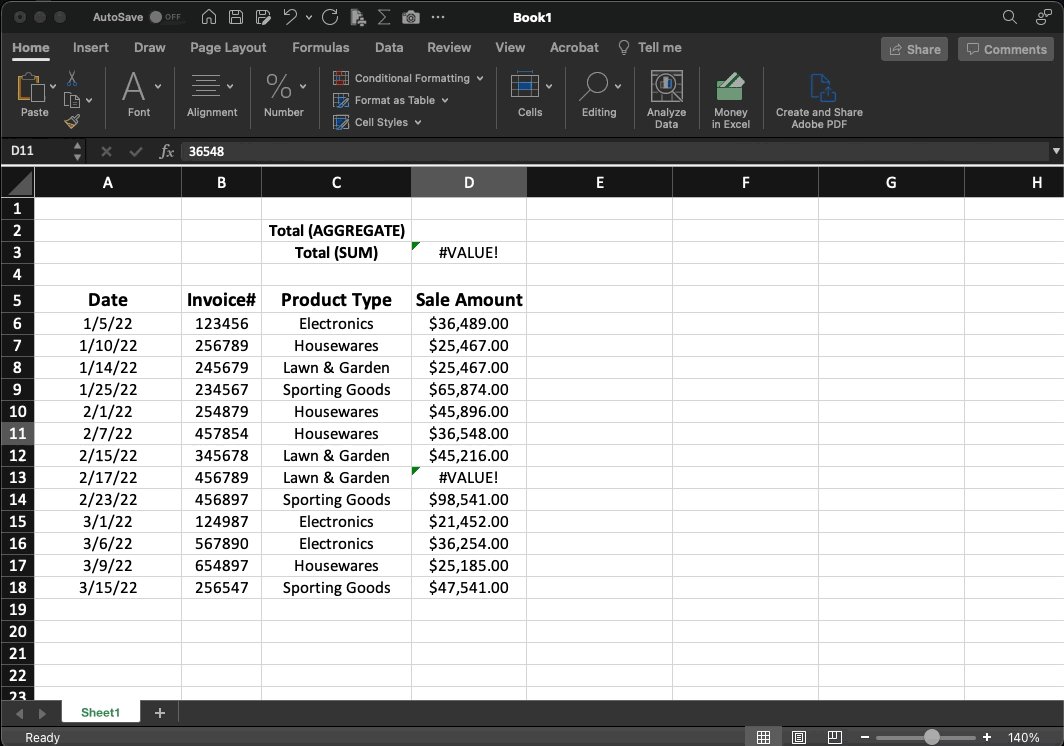
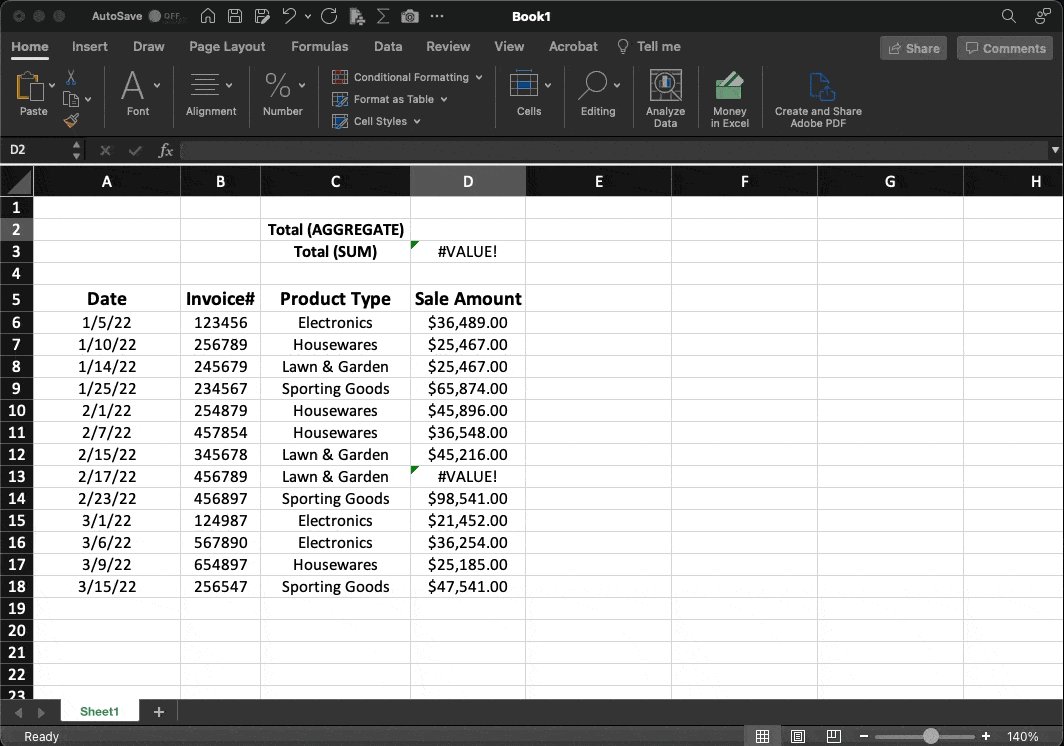
AGGREGATE:
This function returns the result of an aggregate calculation like Average, Count, Sum, Max, or Min.
What makes it special?
Aggregate performs these functions while allowing you to ignore errors, hidden rows, blanks, and more.
Here's how:
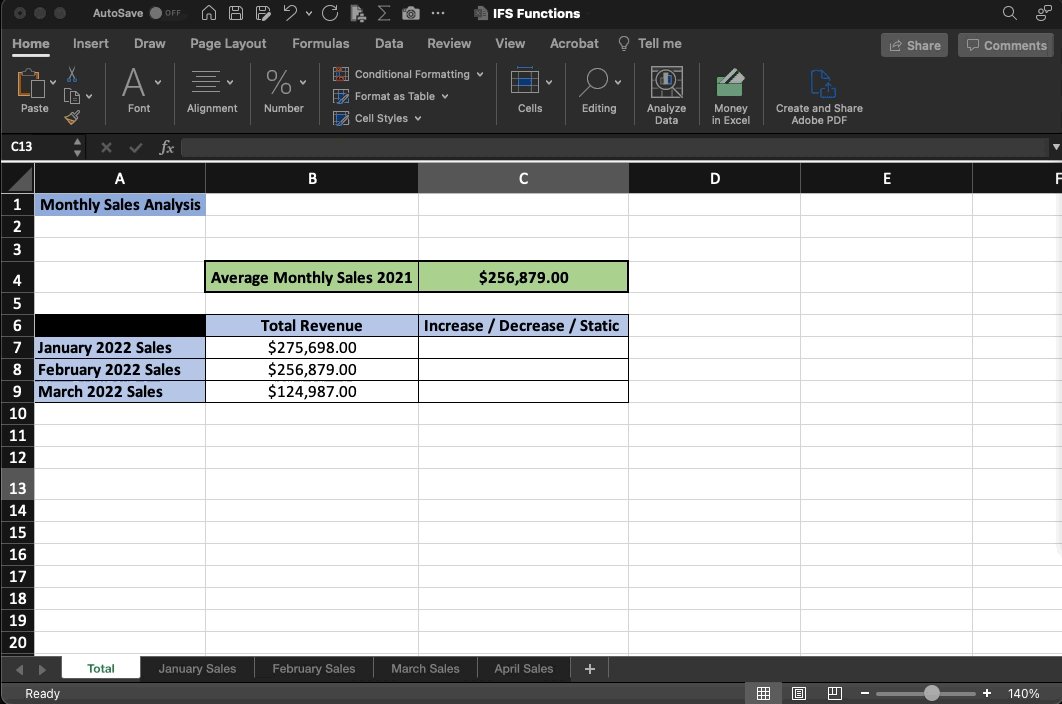
IFS FUNCTION:
The IFS function tests multiple conditions to find out if they are true based on the criteria you provide.
Here, we're going to test if our monthly sales increased, decreased, or remained static in relation to our average.
Use '$' to lock in the reference cell.
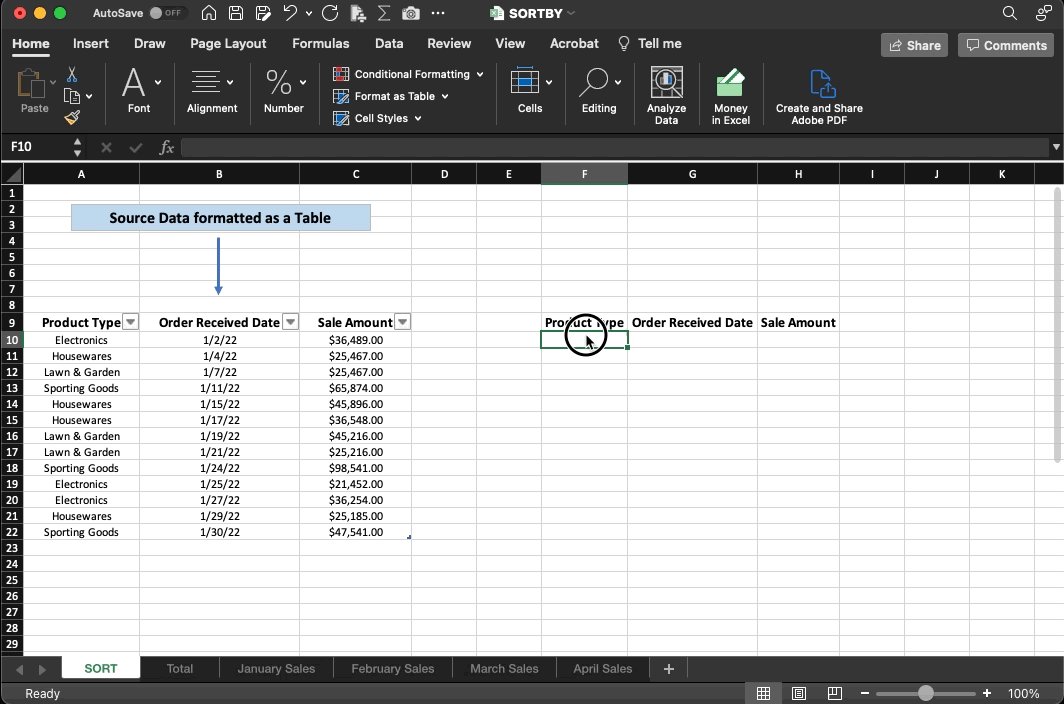
SORTBY:
I'm a fan of organized data.
What I'm not a fan of?
Manually updating my sort every time something changes or new information is added.
Here's an easy fix.
With the SORTBY function, we can create a table that dynamically adjusts along with our data in real-time.
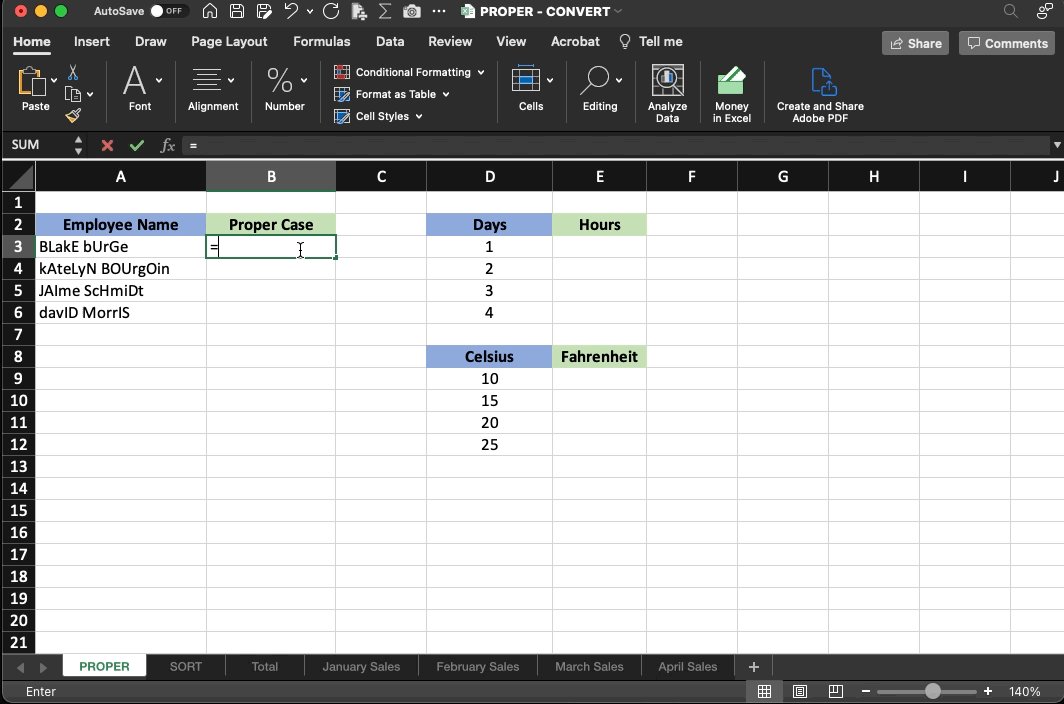
PROPER / CONVERT
• Proper: Quickly check your work & fix typing errors to ensure you have proper case.
Helpful when importing data from an outside source.
• Convert: Easily convert data into an alternate unit of measure.
Days –> Hours
Celsius -> Fahrenheit
+ Many more!
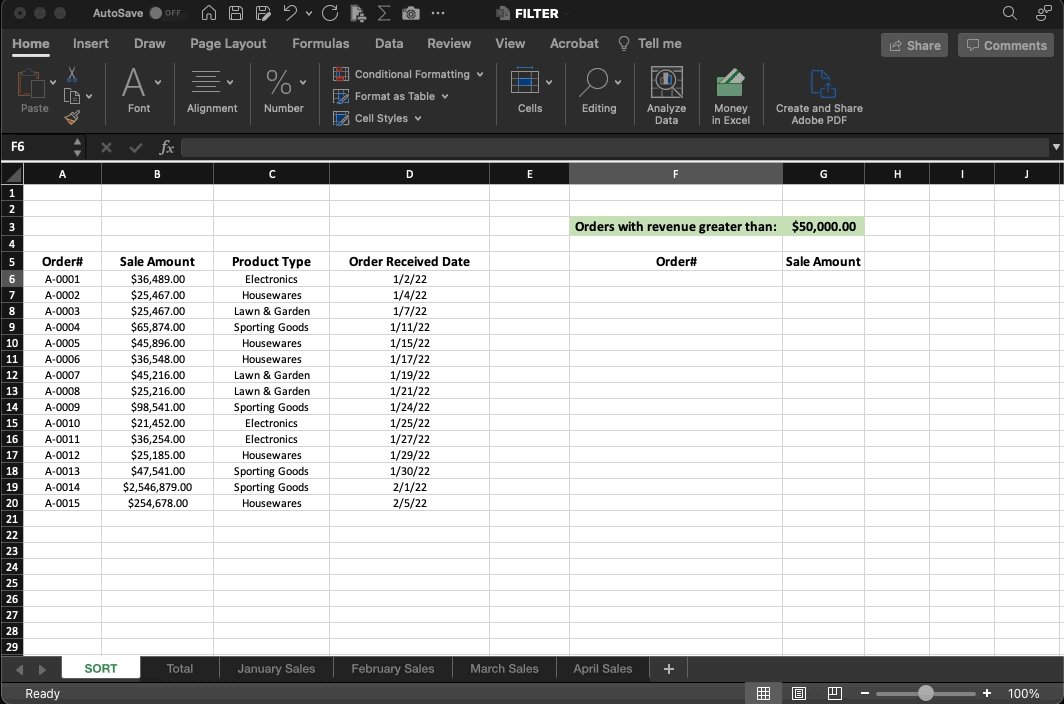
FILTER:
Using the Filter function we can create dashboards that allow us to view results from our data that meet specific criteria.
For example:
Here we want to see only orders that are > than the specified revenue amount.
Change the amount & the data updates automatically.
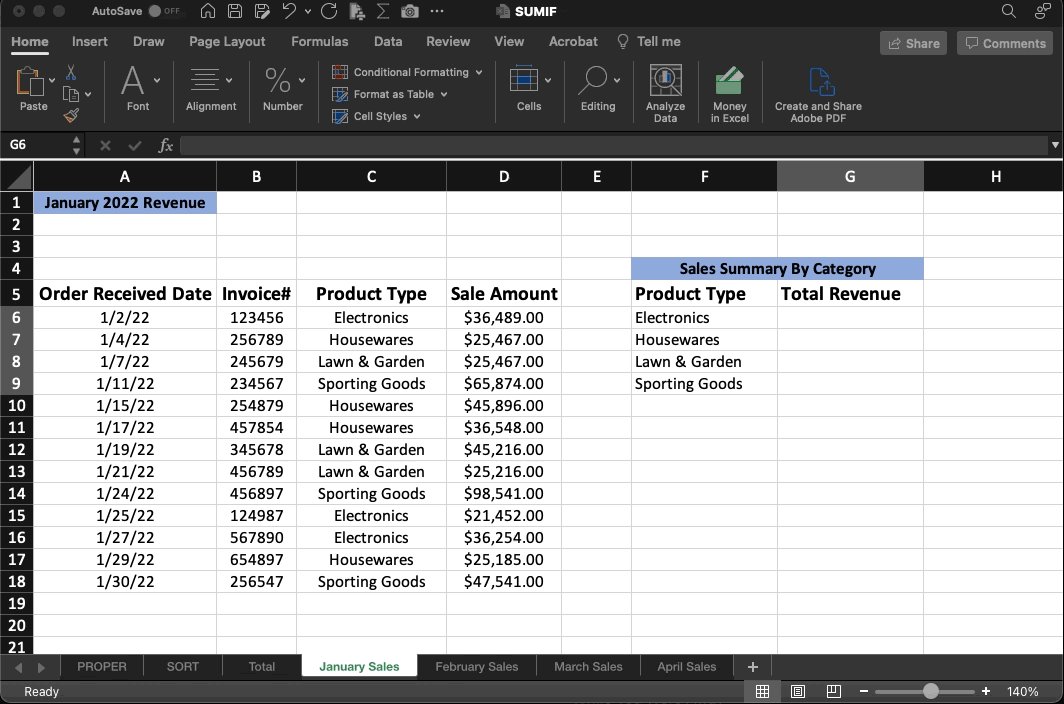
SUMIF:
The SUMIF function is particularly useful when you need to see totals segmented by category.
In our example, we see a breakdown of total revenue for the month by each department.
Just select your range, pick the criteria, and choose the column you would like to SUM.
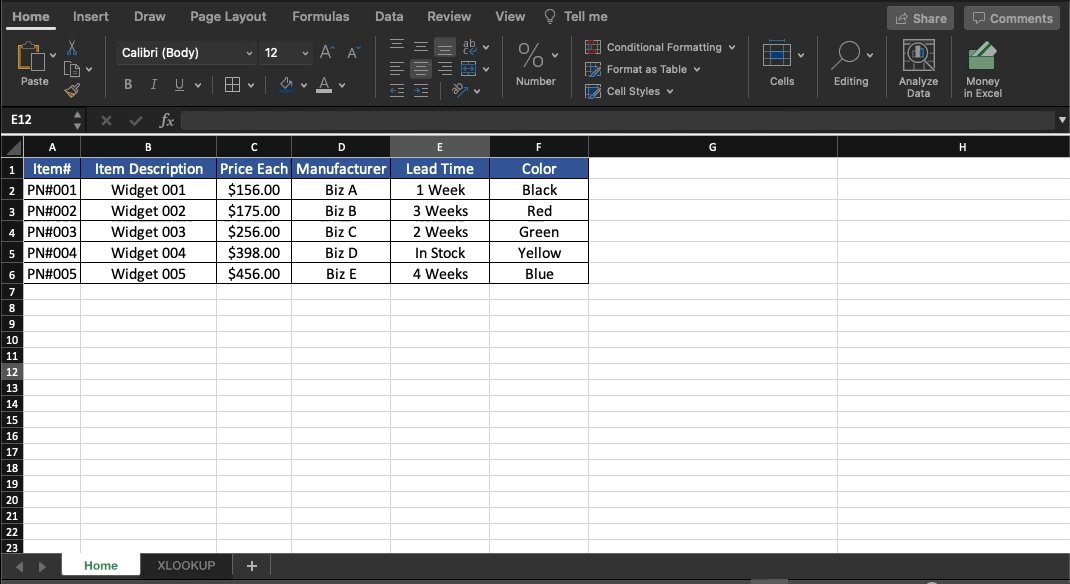
XLOOKUP: (MS365)
If you're an old-school Excel user, there's no doubt you're familiar with V-Lookup.
X is the new & improved version, here's why:
•Lookup array does NOT have to be only on the left-hand side.
•Allows you to return multiple values at the same time.
That's all for today!
Follow me
@blakeaburge for weekly threads on business, productivity, & building a better you.
Join over 7,000 others & check out my newsletter:
"While You Were Away"
•The best of Twitter
•In your inbox
•Every Sunday
https://t.co/KPDWcXYbFv
One last thing...
If you're like me & enjoy making your day more productive, check out what
https://t.co/y9mt4vGZIL is building!
• Calendar
• Meeting notes
• Tasks––in one place
You've got nothing to lose.
The basic plan is $0.00––forever. 👇🏻
https://t.co/Uo1SjNPaQW