
DivisLab
Cmp: 4519
Keep at 👀 for 4900/5700 levels. Needs to hold 4180 for now.

More from Abhishek
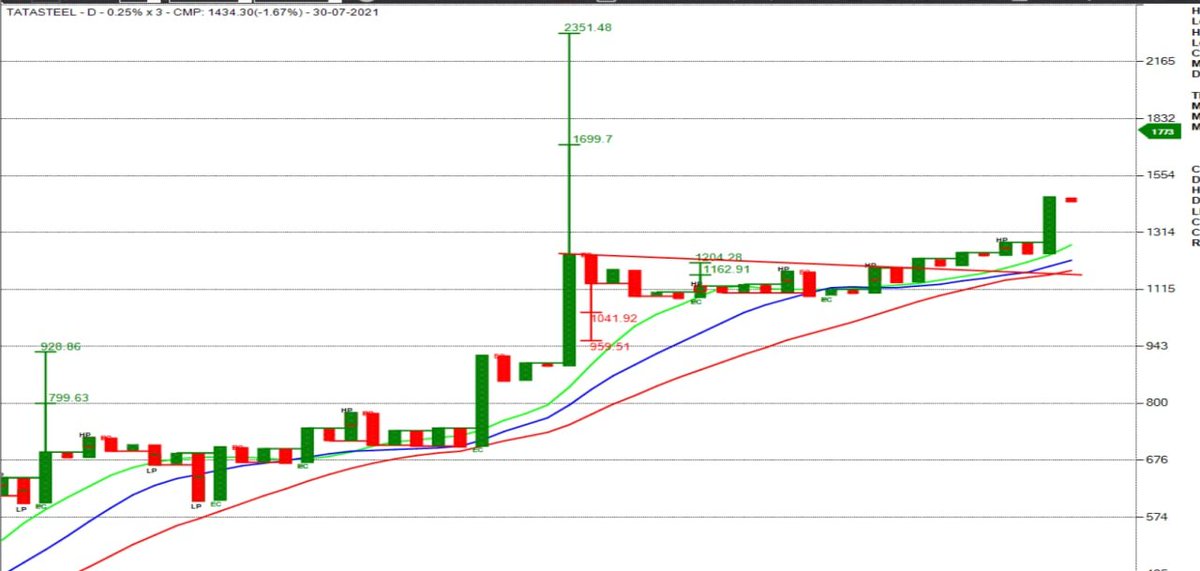
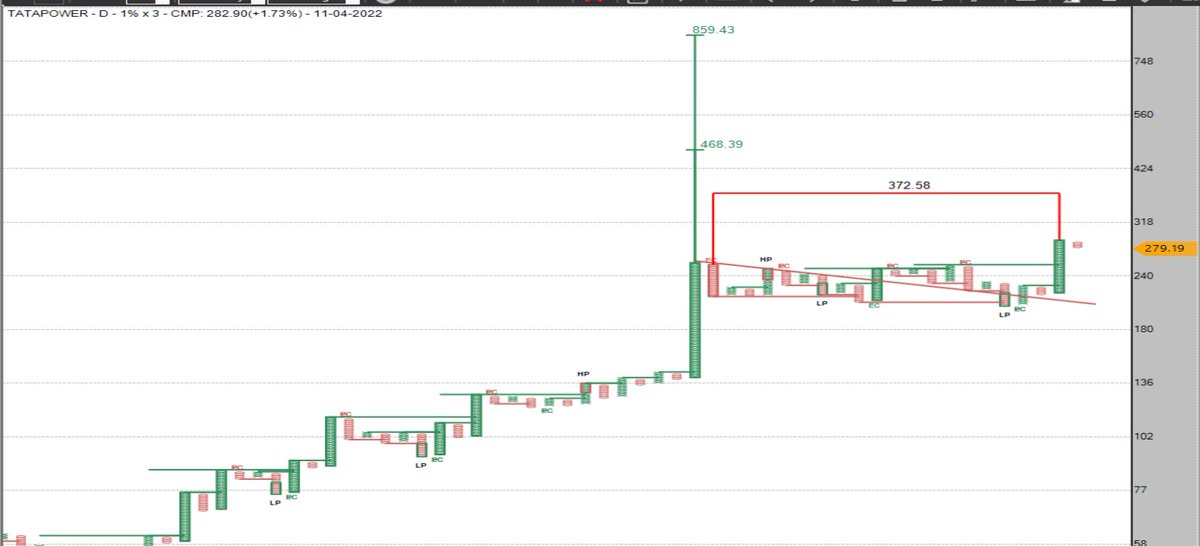
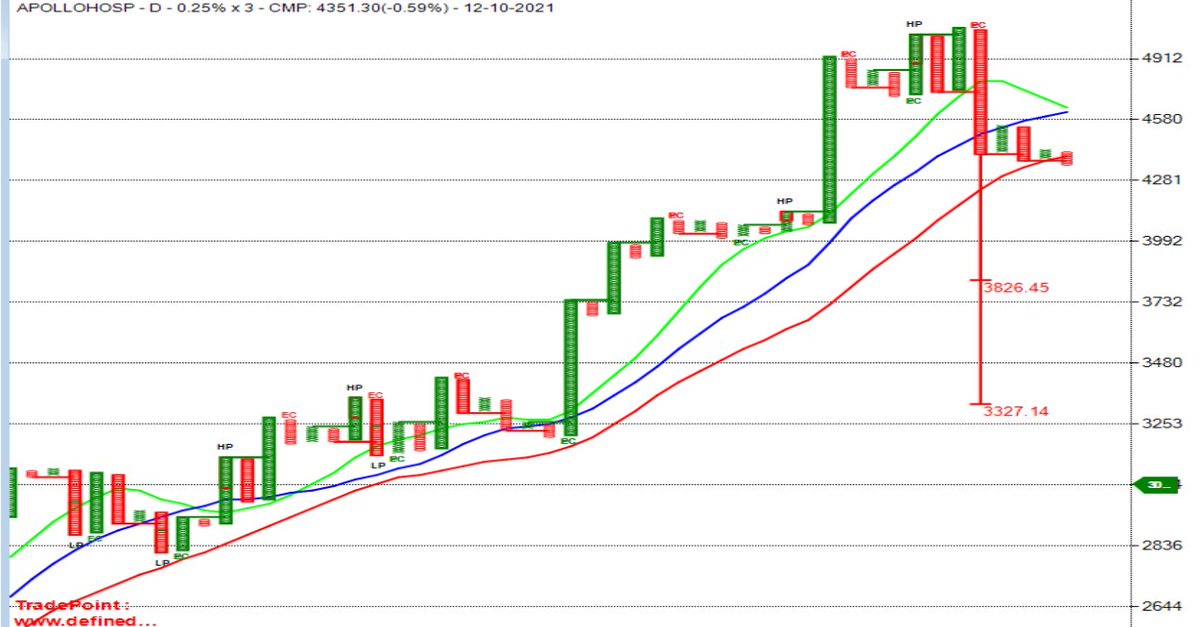
Nifty Futures Positional Trading Using Point & Figure Charts
Following this system on stocks since 2021 and started on Index in 2022
Based on Richard Dennis's Turtle Trading System and the P&F version was created by @Prashantshah267
Details
Chart Settings
Instrument: Nifty Futures ( Current Month)
Chart : Point & Figure
Box Size: 0.10%
Reversal Box: 3
Data Frequency- 1 Min
P&F Charts don't have concept of time but it has a concept Data Frequency, i.e. duration after which to consider plotting X or O on the chart
Since DF is 1 Min here, so we need to wait for 1 Min closing on P&F Charts for Entry, Exit Signals
The chart is an Intraday Chart & requires Intraday data
Which is available on the Real Time Tradepoint Software & on the Web Version of this software
https://t.co/oAshC7rfD1
-
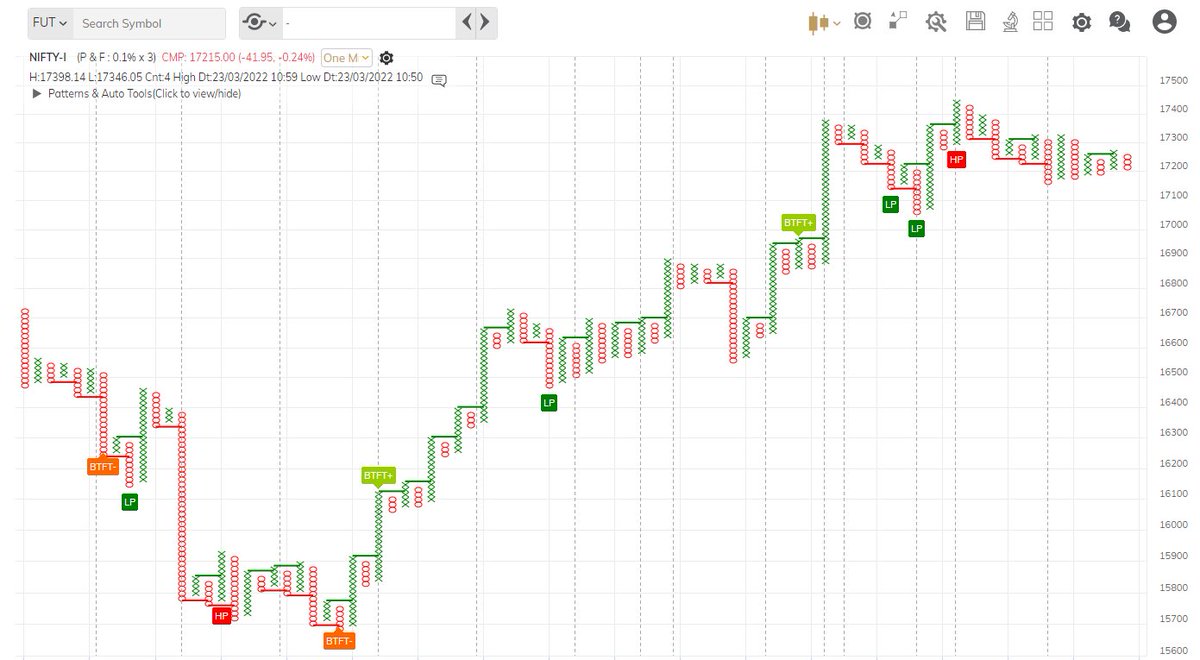
Let's now Discuss Bullish Entry Pattern
The Entry Pattern is called as a Bullish Follow Through Turtle Buy Pattern
This actually comprises of 2 Parts
1. Bullish Turtle Breakout
2. Bullish Turtle Follow Through
For Entry, #1 must happen and there must be a #2 immediately
First Let's Understand the Bullish Turtle Breakout Pattern
This is a 5 X BO Pattern
If current column of X goes above highest ‘X’ in last 5 columns (including current column), then it is a 5-X Turtle breakout.
Following this system on stocks since 2021 and started on Index in 2022
Based on Richard Dennis's Turtle Trading System and the P&F version was created by @Prashantshah267
Details
Chart Settings
Instrument: Nifty Futures ( Current Month)
Chart : Point & Figure
Box Size: 0.10%
Reversal Box: 3
Data Frequency- 1 Min
P&F Charts don't have concept of time but it has a concept Data Frequency, i.e. duration after which to consider plotting X or O on the chart
Since DF is 1 Min here, so we need to wait for 1 Min closing on P&F Charts for Entry, Exit Signals
The chart is an Intraday Chart & requires Intraday data
Which is available on the Real Time Tradepoint Software & on the Web Version of this software
https://t.co/oAshC7rfD1
-
Let's now Discuss Bullish Entry Pattern
The Entry Pattern is called as a Bullish Follow Through Turtle Buy Pattern
This actually comprises of 2 Parts
1. Bullish Turtle Breakout
2. Bullish Turtle Follow Through
For Entry, #1 must happen and there must be a #2 immediately
First Let's Understand the Bullish Turtle Breakout Pattern
This is a 5 X BO Pattern
If current column of X goes above highest ‘X’ in last 5 columns (including current column), then it is a 5-X Turtle breakout.
You May Also Like


1/x Fort Detrick History
Mr. Patrick, one of the chief scientists at the Army Biological Warfare Laboratories at Fort Detrick in Frederick, Md., held five classified US patents for the process of weaponizing anthrax.
2/x
Under Mr. Patrick’s direction, scientists at Fort Detrick developed a tularemia agent that, if disseminated by airplane, could cause casualties & sickness over 1000s mi². In a 10,000 mi² range, it had 90% casualty rate & 50% fatality rate

3/x His team explored Q fever, plague, & Venezuelan equine encephalitis, testing more than 20 anthrax strains to discern most lethal variety. Fort Detrick scientists used aerosol spray systems inside fountain pens, walking sticks, light bulbs, & even in 1953 Mercury exhaust pipes
4/x After retiring in 1986, Mr. Patrick remained one of the world’s foremost specialists on biological warfare & was a consultant to the CIA, FBI, & US military. He debriefed Soviet defector Ken Alibek, the deputy chief of the Soviet biowarfare program
https://t.co/sHqSaTSqtB
5/x Back in Time
In 1949 the Army created a small team of chemists at "Camp Detrick" called Special Operations Division. Its assignment was to find military uses for toxic bacteria. The coercive use of toxins was a new field, which fascinated Allen Dulles, later head of the CIA
Mr. Patrick, one of the chief scientists at the Army Biological Warfare Laboratories at Fort Detrick in Frederick, Md., held five classified US patents for the process of weaponizing anthrax.
2/x
Under Mr. Patrick’s direction, scientists at Fort Detrick developed a tularemia agent that, if disseminated by airplane, could cause casualties & sickness over 1000s mi². In a 10,000 mi² range, it had 90% casualty rate & 50% fatality rate
3/x His team explored Q fever, plague, & Venezuelan equine encephalitis, testing more than 20 anthrax strains to discern most lethal variety. Fort Detrick scientists used aerosol spray systems inside fountain pens, walking sticks, light bulbs, & even in 1953 Mercury exhaust pipes
4/x After retiring in 1986, Mr. Patrick remained one of the world’s foremost specialists on biological warfare & was a consultant to the CIA, FBI, & US military. He debriefed Soviet defector Ken Alibek, the deputy chief of the Soviet biowarfare program
https://t.co/sHqSaTSqtB
5/x Back in Time
In 1949 the Army created a small team of chemists at "Camp Detrick" called Special Operations Division. Its assignment was to find military uses for toxic bacteria. The coercive use of toxins was a new field, which fascinated Allen Dulles, later head of the CIA


Nano Course On Python For Trading
==========================
Module 1
Python makes it very easy to analyze and visualize time series data when you’re a beginner. It's easier when you don't have to install python on your PC (that's why it's a nano course, you'll learn python...
... on the go). You will not be required to install python in your PC but you will be using an amazing python editor, Google Colab Visit https://t.co/EZt0agsdlV
This course is for anyone out there who is confused, frustrated, and just wants this python/finance thing to work!
In Module 1 of this Nano course, we will learn about :
# Using Google Colab
# Importing libraries
# Making a Random Time Series of Black Field Research Stock (fictional)
# Using Google Colab
Intro link is here on YT: https://t.co/MqMSDBaQri
Create a new Notebook at https://t.co/EZt0agsdlV and name it AnythingOfYourChoice.ipynb
You got your notebook ready and now the game is on!
You can add code in these cells and add as many cells as you want
# Importing Libraries
Imports are pretty standard, with a few exceptions.
For the most part, you can import your libraries by running the import.
Type this in the first cell you see. You need not worry about what each of these does, we will understand it later.