it seems dumb, and almost counter-intuitive to approach such a complex game like trading with such a simple approach like shapes...but maybe when markets start acting stupid its okay to dumb down our approach.
TRIANGLE MASTERCLASS - a thread.
what's the simplest, most effective method of trading a market that trends as hard as cryptocurrencies?
trendlines.
one trendline on its own is strong, but when you put two together you quickly realize just how powerful this simple tool can be.

it seems dumb, and almost counter-intuitive to approach such a complex game like trading with such a simple approach like shapes...but maybe when markets start acting stupid its okay to dumb down our approach.
anybody can draw some lines on a chart any way they'd like. sometimes, we let our bias affect our charts rather than the other way around.
i personally have done this more times than i can count.
you want a fluid bias that can change easily, rather than one relying on 10 steps of conflicting confirmation before entering a new trade
i mean, how much simpler can it be than "above this line bullish, below this line bearish" ? 😂
one trendline on its own can be enough to make a good trade, but when you put two together it can turn a good trade into a great one.
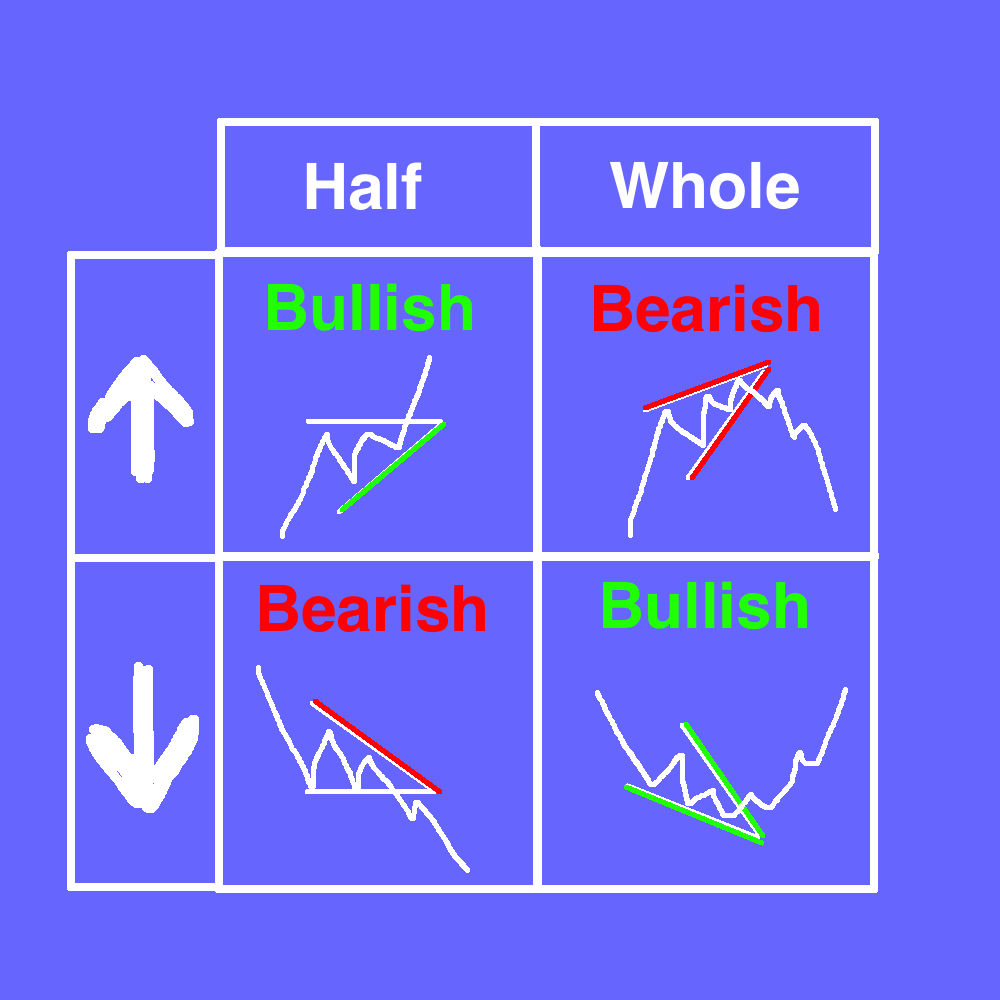
two types: halves and wholes
two directions: up and down
why are they called halves?
well...simply because they're halves of wholes.
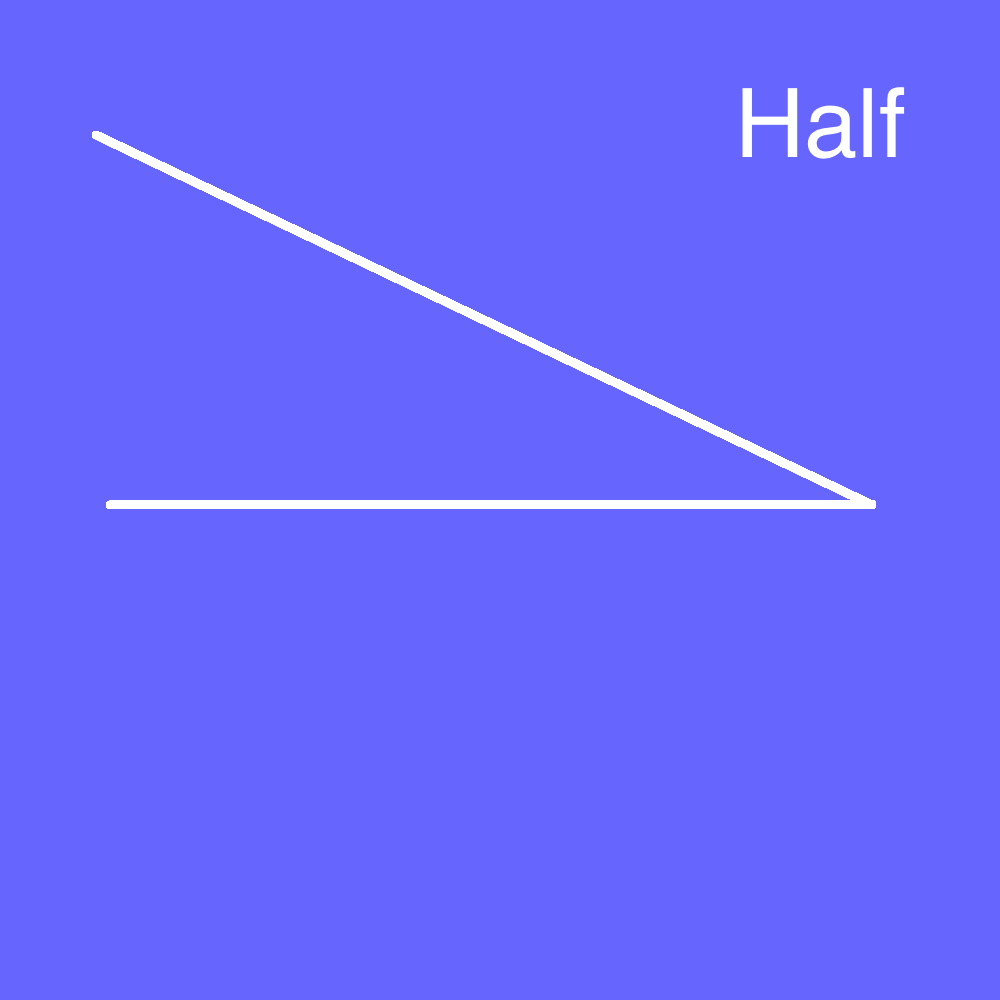
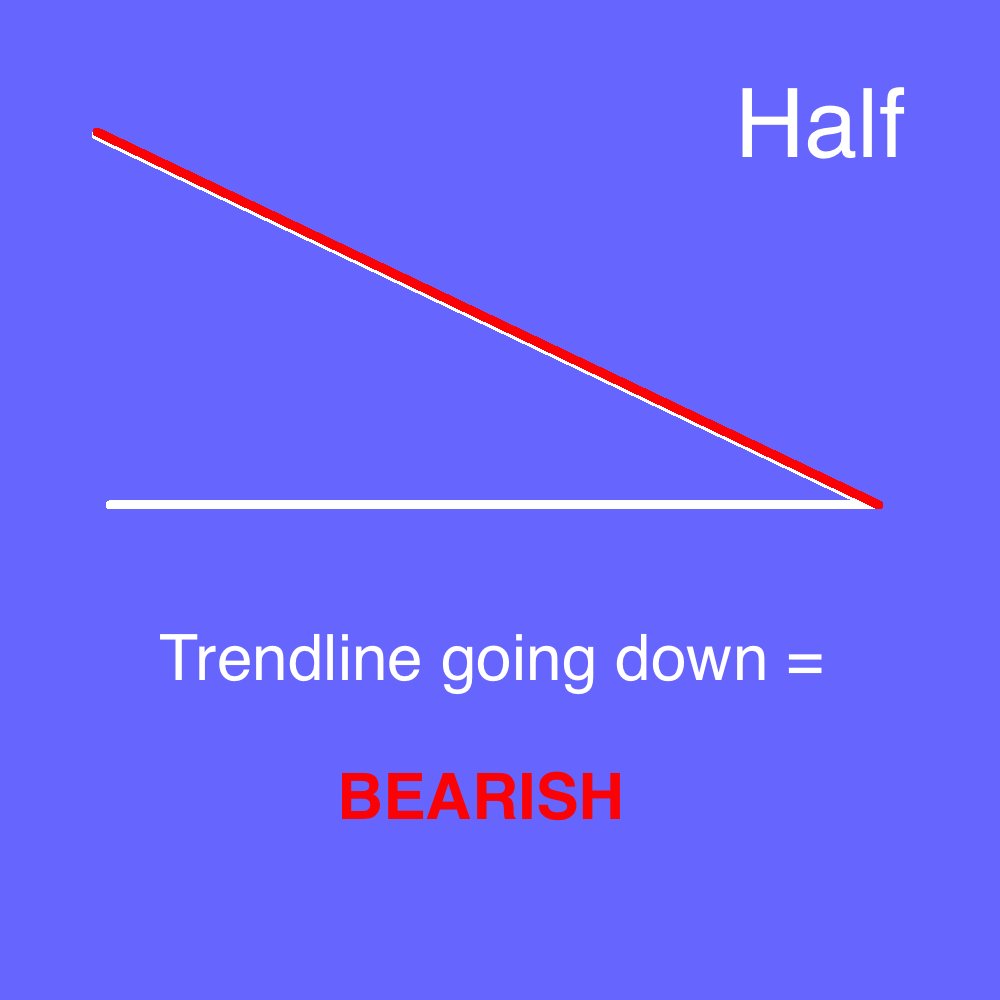
it then becomes very simple as the direction of the side thats not flat dictates if you're bullish or bearish.
trendline up = bullish ... trendline down = bearish
it's that simple.
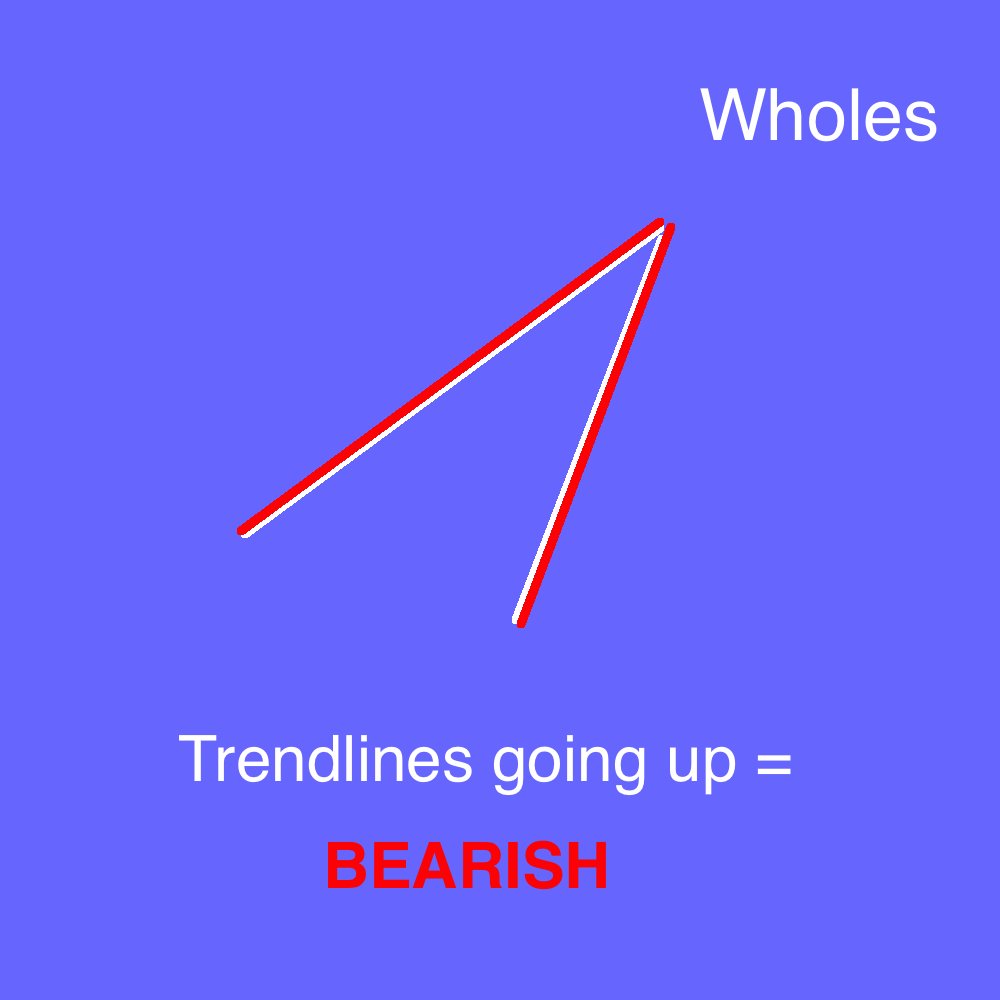
wholes are interesting because with halves, your trendline dictates that price will *CONTINUE* in that direction...
while with wholes your trendlines actually dictate that price will *REVERSE*
well...that wouldn't be true in every market environment.
but when you're participating in a market that trends as hard as crypto is right now...it certainly can be
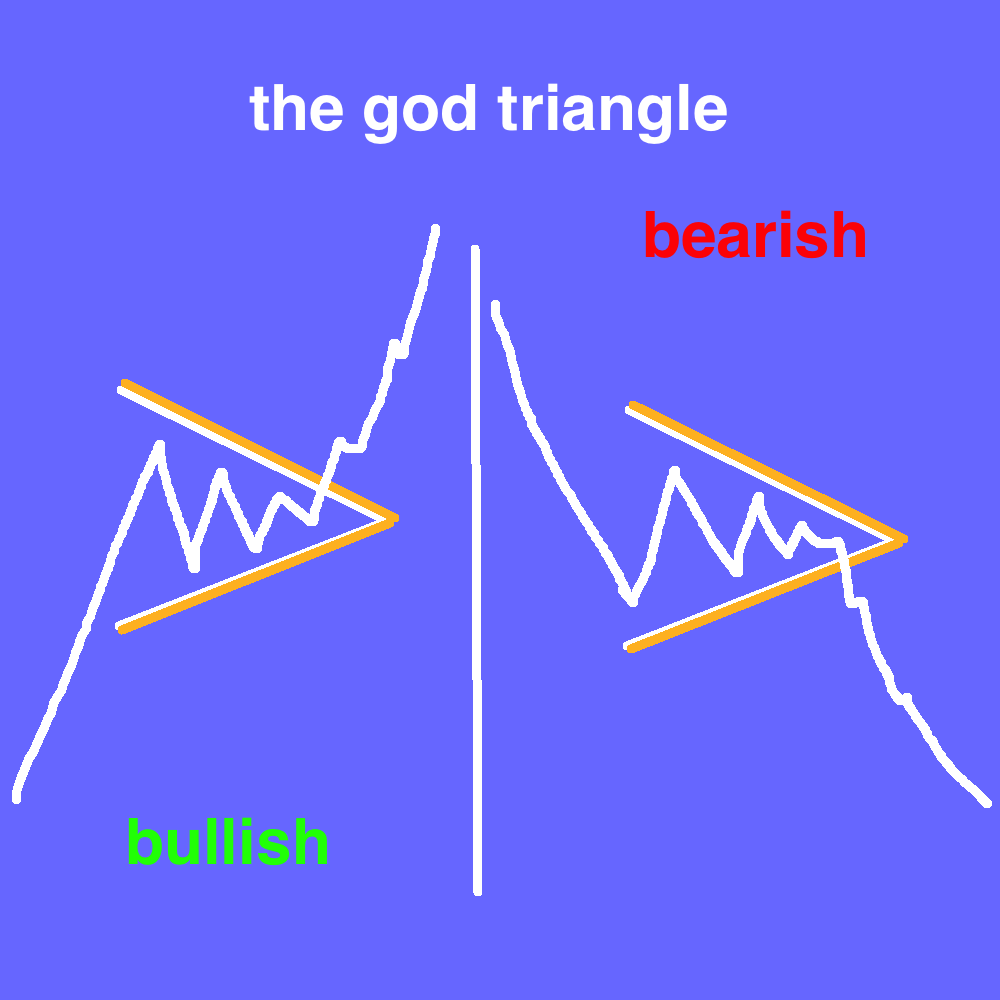
the god triangle.

the way way that price cycles, momentum does as well.
coins rally, then they cool off, and then they either rally more or reverse.
it represents a continuation in trend.
so if price was going *up* into the triangle, its bullish
if price was going *down* into the triangle, its bearish
within the triangle, price is compressing.
remember price goes up, then stalls, then either keeps going up or reverses.
expansion -> compression -> expansion
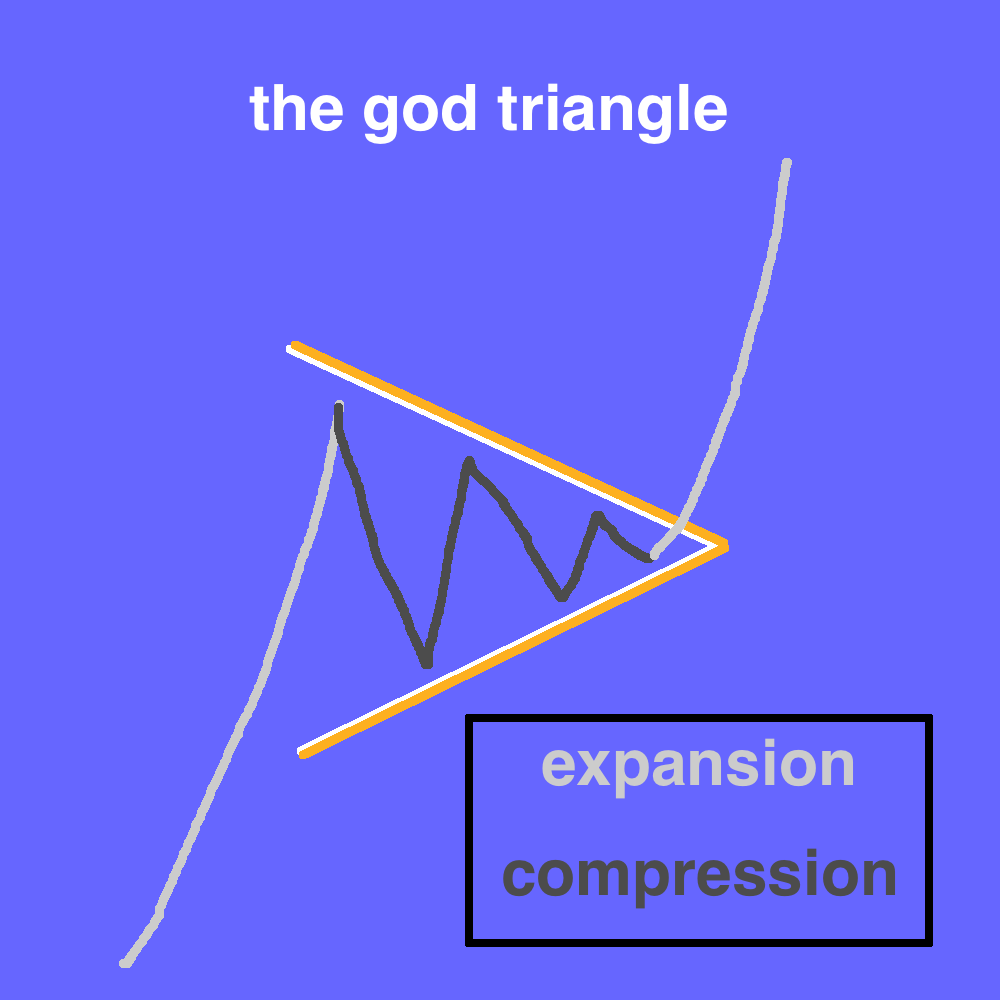
you place your stoploss either below the trendline...or below the previous low that was set within the triangle
this is how you give yourself high hit-rate, high R/R plays.
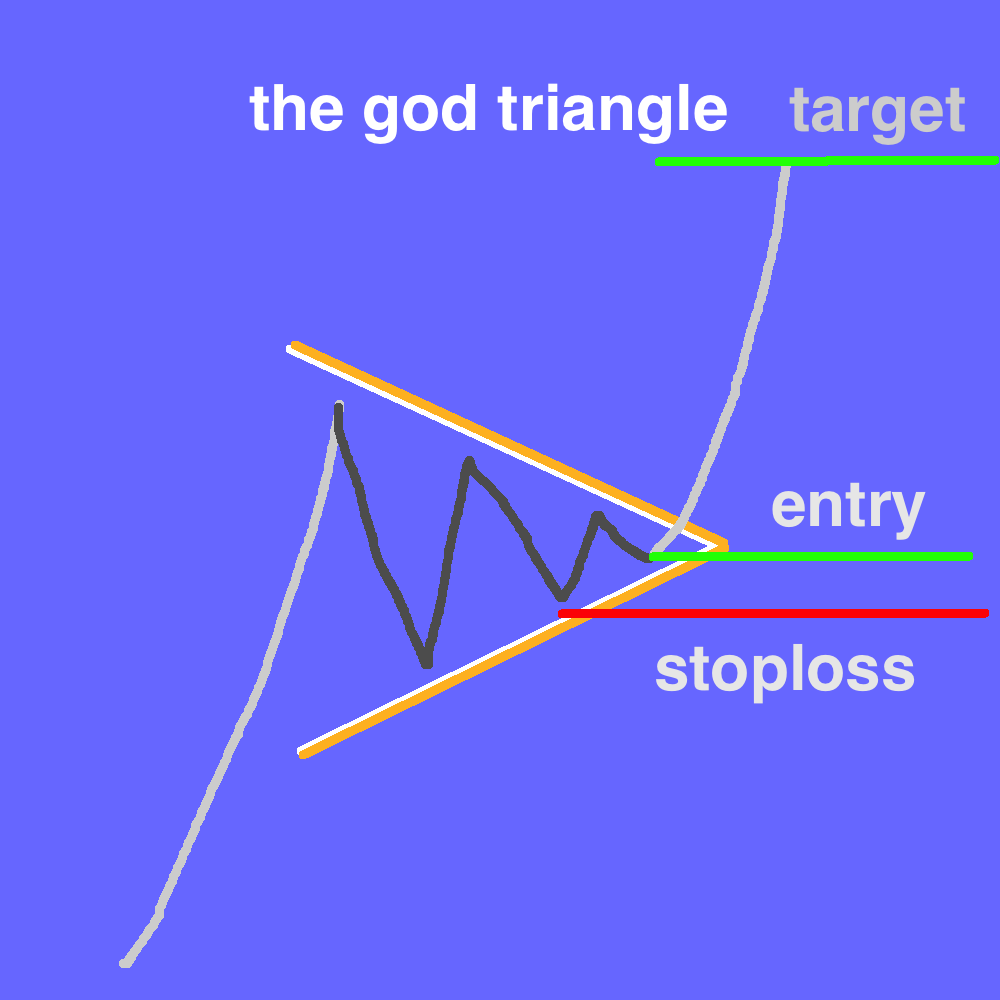
the god triangle gives you the best of both worlds.
for more trading tips & tutorials join the nearly 5,000 others learning today!
https://t.co/DFOPJPdZKd
More from Crypto





Michael Pettis @michaelxpettis argues that it is not always obvious who (China or the U.S.) adjusts best to "turbulent changes."
Bitcoin answers that question.
Thread:
World economies currently suffer four major redistribution challenges:
The most important is increasing government stealth use of the monetary system to confiscate assets from productive actors.
/2
That process is exacerbated by "Cantillon Effect" transfers to interest groups close to government ("the entitled class," public sector workers, the medical industrial complex, academia, etc....), which is destroying much of that wealth /3
The shadow nature (see Keynes) of government inflation makes the process unidentifiable, un-addressable and undemocratic.
The biggest victims (America's poorly educated young) are unequipped to counter generational confiscation tactics of today's wily senior beneficiaries. /4
Government control of the numéraire in key economic statistics (GDP, inflation, etc...) makes it impossible for economic actors to measure progress and liabilities. /5
Bitcoin answers that question.
Thread:
1/11
— Michael Pettis (@michaelxpettis) January 11, 2021
An article worth thinking about: \u201cAs changes to the world structure accelerate, China\u2019s rule is in sharp contrast with the turmoil in the West,\u201d says Beijing.
I agree, but I draw a different conclusion. The world is certainly currently going...https://t.co/ugha7ygqqx
World economies currently suffer four major redistribution challenges:
The most important is increasing government stealth use of the monetary system to confiscate assets from productive actors.
/2
That process is exacerbated by "Cantillon Effect" transfers to interest groups close to government ("the entitled class," public sector workers, the medical industrial complex, academia, etc....), which is destroying much of that wealth /3
The shadow nature (see Keynes) of government inflation makes the process unidentifiable, un-addressable and undemocratic.
The biggest victims (America's poorly educated young) are unequipped to counter generational confiscation tactics of today's wily senior beneficiaries. /4
Government control of the numéraire in key economic statistics (GDP, inflation, etc...) makes it impossible for economic actors to measure progress and liabilities. /5