With Bitcoin's rising price I get many people asking me my opinion about it: Here are nine tips
1) Don't take advice about Bitcoin from those with a vested interest in seeing its price rise. That's like listening to CDO dealer in 2006. When prices go up, critical thought go down
More from Crypto


🚨Altcoin Trading Indicator🚨
How to use it. A THREAD.
Please Share.
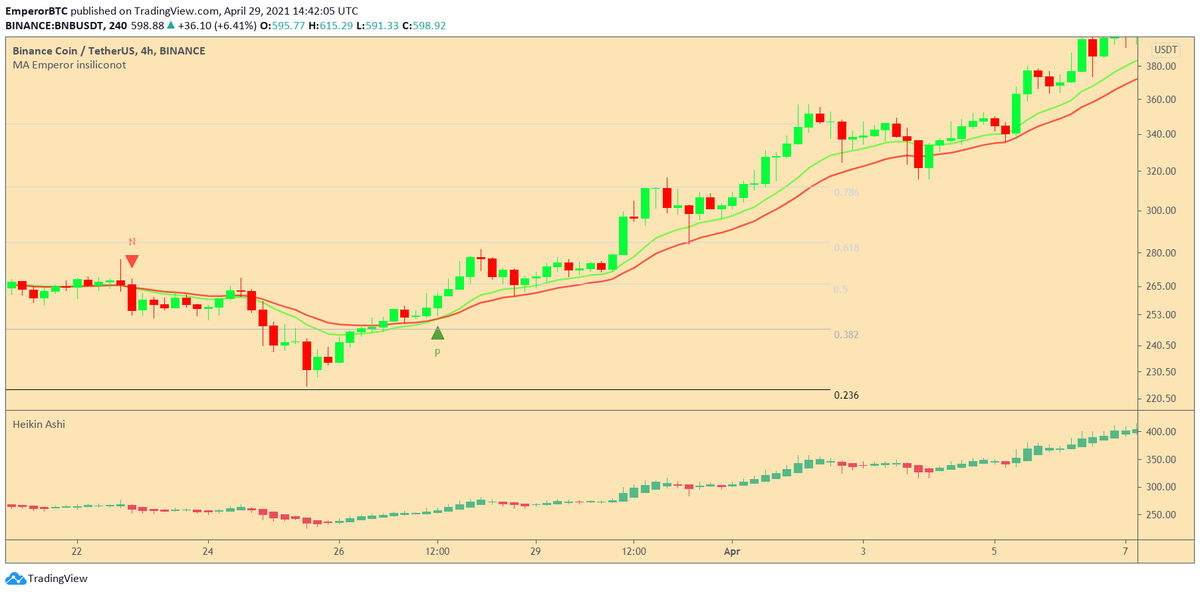
To use it to buy Altcoins and make a high probability entry, the following conditions needs to be fulfilled.
For a long.
1. A green candle Closes above the cross.
2. Heikin Ashi candle turns green.
3. Price should be above 0.236 Fib from the swing high.
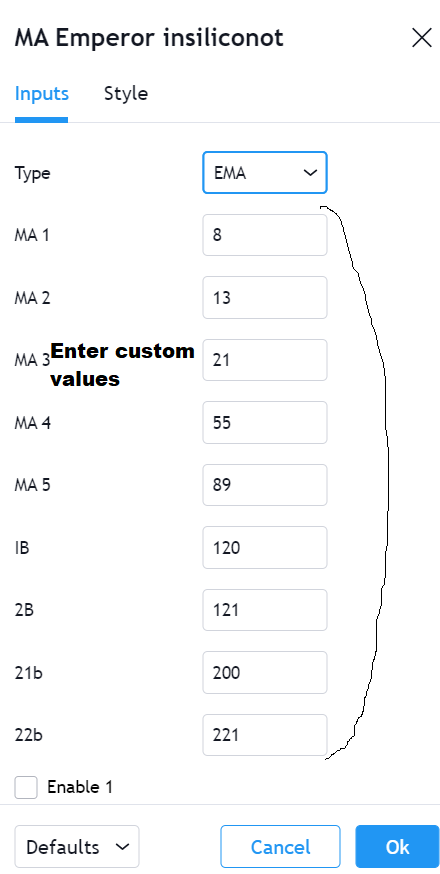
How to add the Indicator.
1. Click on the link and Add it to favorites and apply.
https://t.co/Kn90qgDjMi
2. Or Search it in the tab and then apply it.
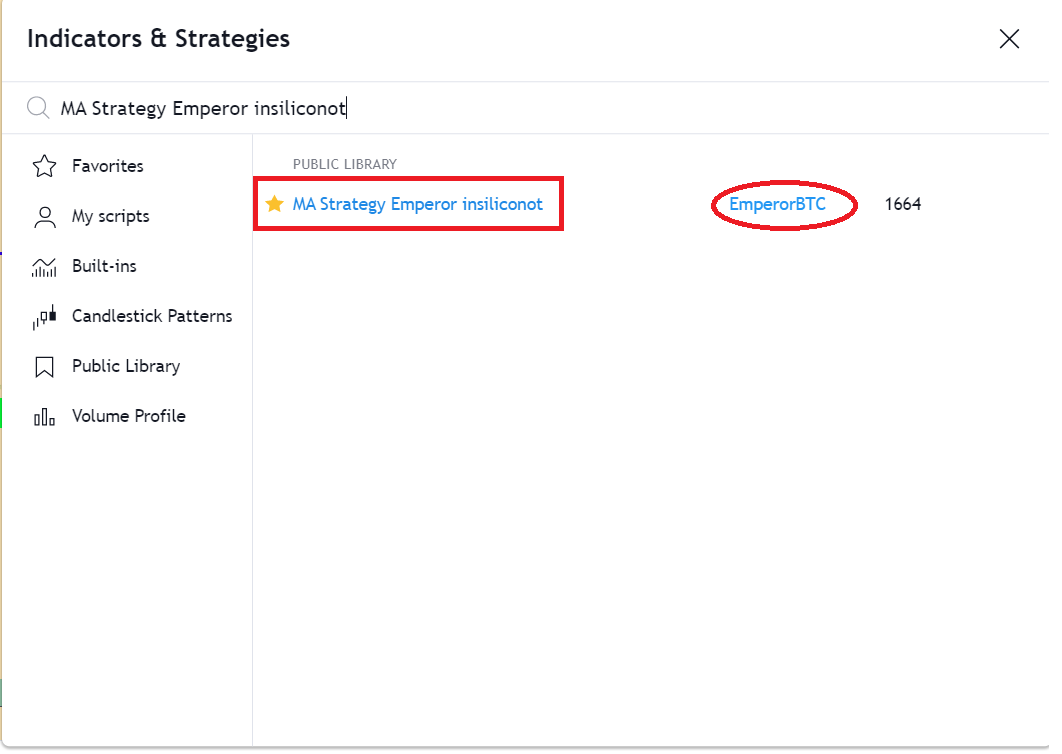
The indicator itself the most comprehensive Moving Average Indicator which provides 9 MAs and 13 Different times of MAs.
The base of the indicator was by @insiliconot.
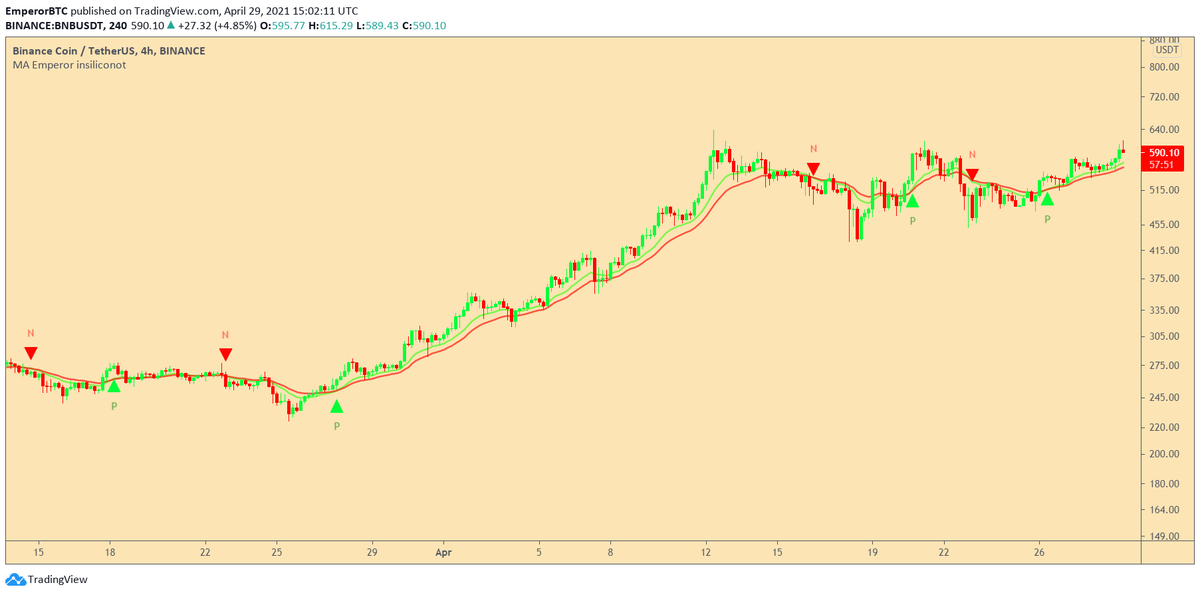
To further enhance it, I have added a cross indicator on the cross which works the best historically on Alts.
Condition 1- The cross.
Entry is made when a Cross occurs on the EMA 13/21.
The indicator automatically indicators the Cross with P for a positive cross or N for a negative cross.
This is the first condition for an Entry.
How to use it. A THREAD.
Please Share.
To use it to buy Altcoins and make a high probability entry, the following conditions needs to be fulfilled.
For a long.
1. A green candle Closes above the cross.
2. Heikin Ashi candle turns green.
3. Price should be above 0.236 Fib from the swing high.
How to add the Indicator.
1. Click on the link and Add it to favorites and apply.
https://t.co/Kn90qgDjMi
2. Or Search it in the tab and then apply it.
The indicator itself the most comprehensive Moving Average Indicator which provides 9 MAs and 13 Different times of MAs.
The base of the indicator was by @insiliconot.
To further enhance it, I have added a cross indicator on the cross which works the best historically on Alts.
Condition 1- The cross.
Entry is made when a Cross occurs on the EMA 13/21.
The indicator automatically indicators the Cross with P for a positive cross or N for a negative cross.
This is the first condition for an Entry.


We are actively working to launch on @binance Smart Chain #BSC .
To make this transition easy & understandable for everyone, we are answering most frequently asked questions here.
Ready? Go! 🔥
1/24
#DeFi #YieldFarming
Q1 - What are the benefits of holding the $VALUE token on the Ethereum Mainnet network? Give me reasons not to sell. Some are assuming that the VALUE token will be abandoned now that vBSWAP is being created. Can you clarify the use case for VALUE?
👉 $VALUE will always be a governance & profit receiving token of the whole ecosystem if staked in #vGov. With the new farming token on #BSC , gvVALUE holders will get extra rewards at BSC if they choose to bridge their gvVALUE to BSC & stake in gvVALUE-B/BUSD 98/2 pool.
Q2 - What do I need to do with my VALUE tokens that are staked in vGov? Is it OK to leave them in the vGov?
👉If you have VALUE but aren't staking in the vGov & you would like to participate in the BSC expansion, you will need to stake your VALUE in the vGov to receive gvVALUE.
If you are staking in vGov but don't see the correct gvVALUE amount in your wallet, go to vGov (https://t.co/udXn5IJtVx) to unlock your gvVALUE from the old contract. There will be a bridge from ETH to BSC to move gvVALUE and vUSD over.