Prepare For The Biggest Bull Run In Crypto EVER.

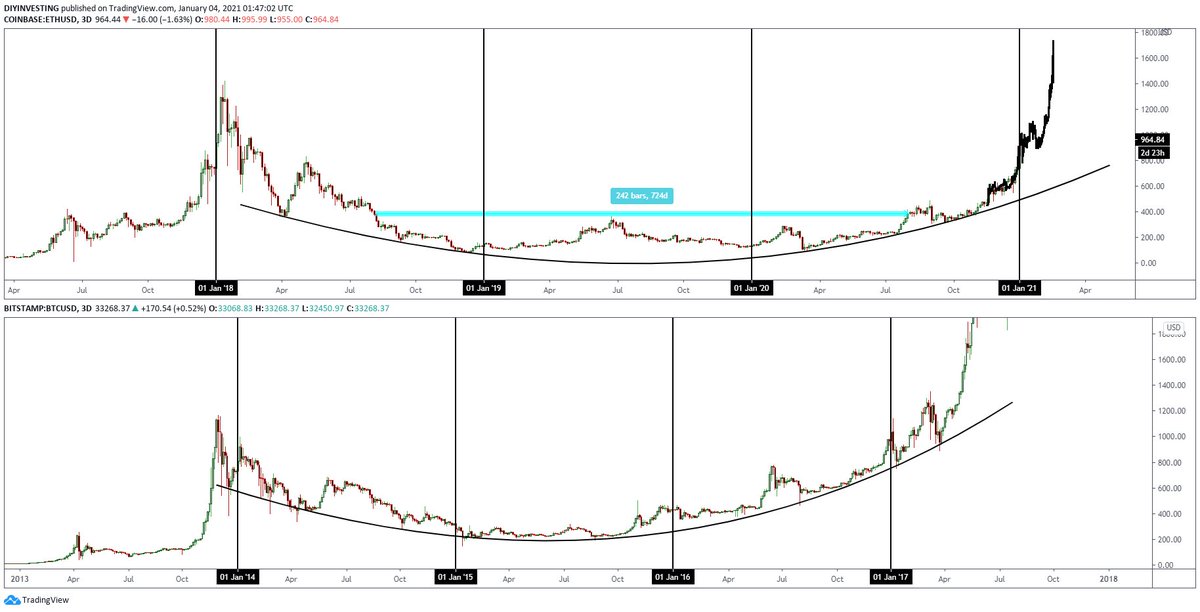
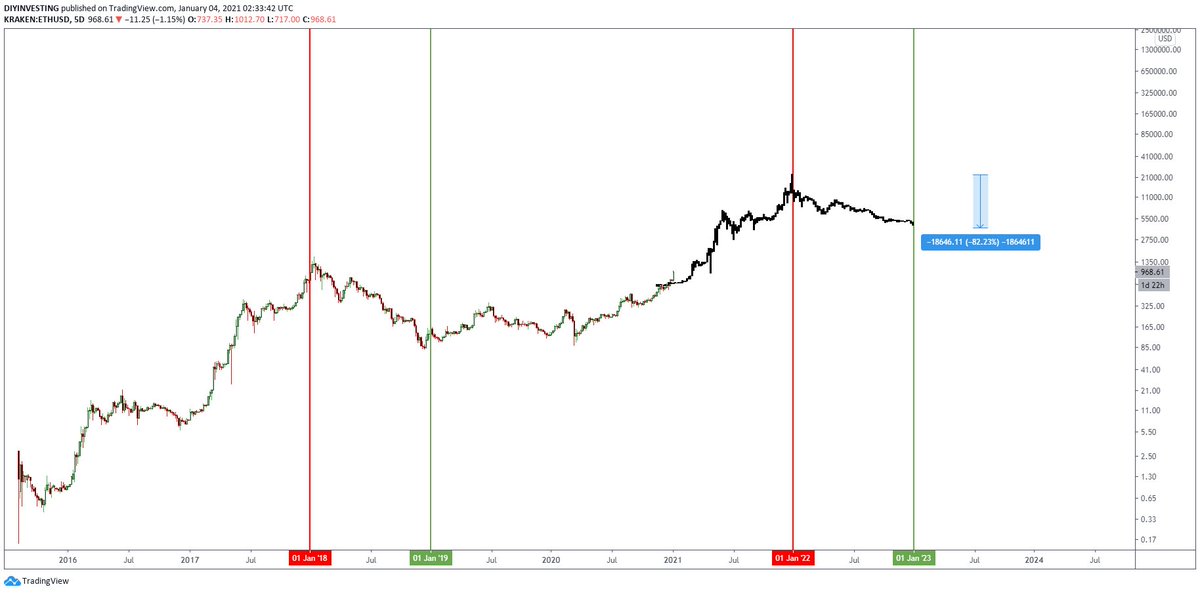
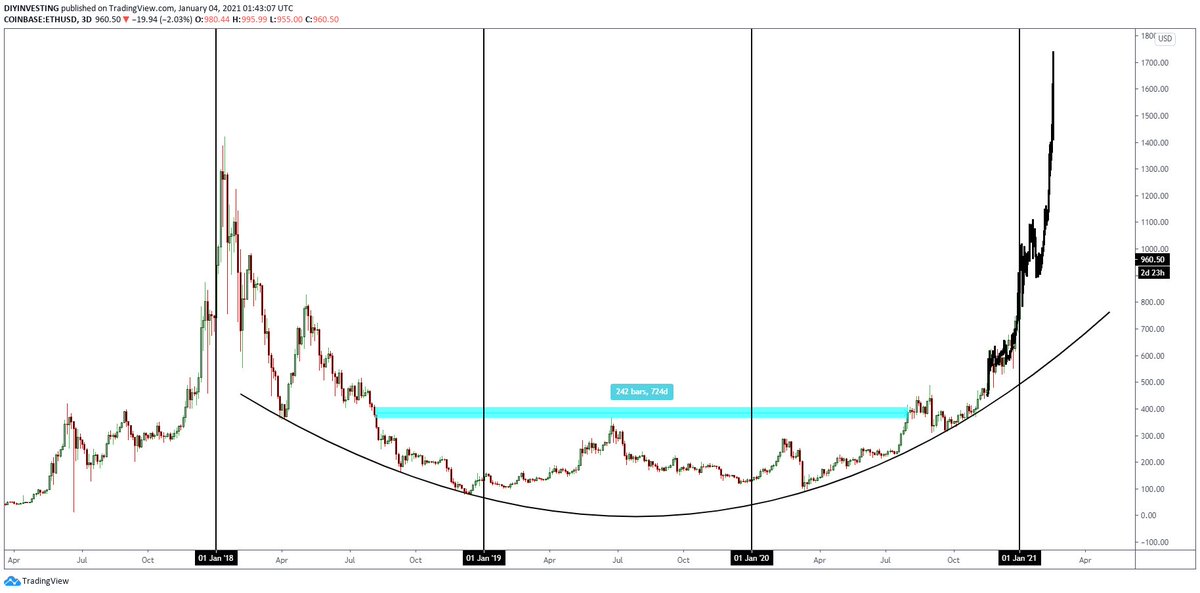
I made some charts explaining the long term trend of #Ethereum and how identical it is to the early #Bitcoin cycles.

It's very obvious what's happening and has been in the charts for months.

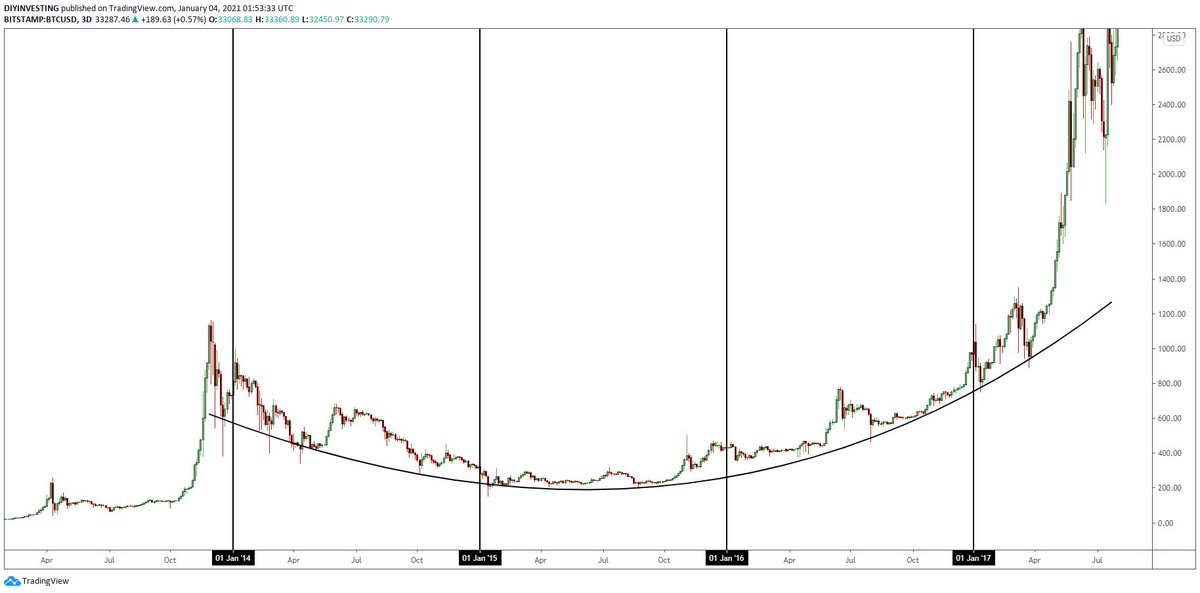
I call this pattern the, "4 Year Bowl."

New years are a time of market shifts both bullish and bearish. Each cycle goes through 4 years of this rounded accumulation pattern. After year 4 we start 1 year of parabolic rise.
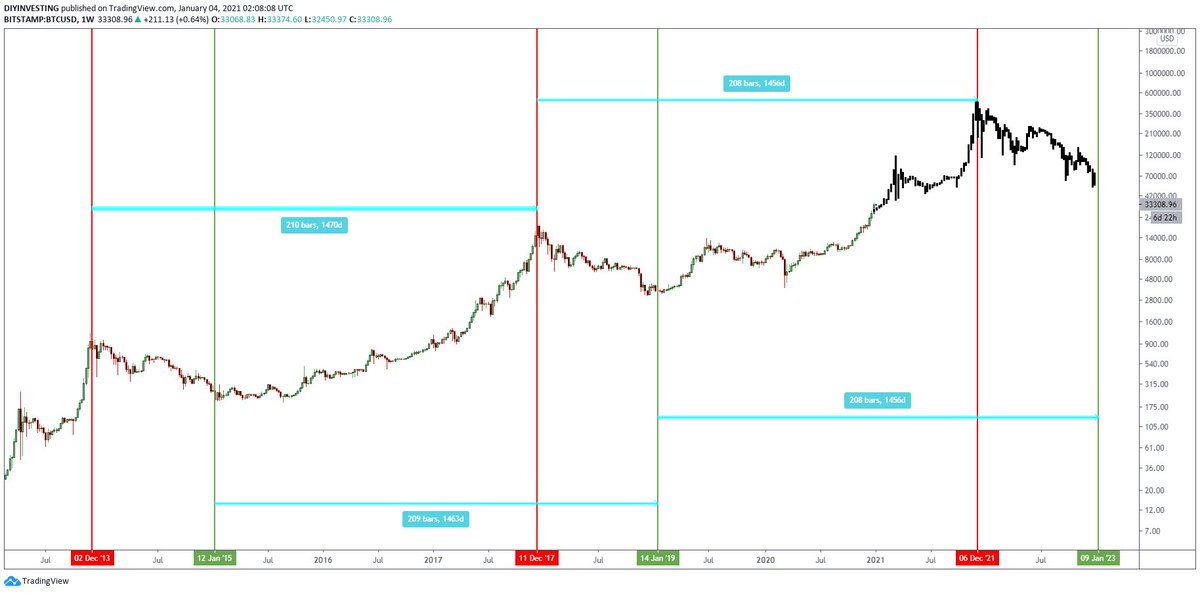
When you take a look at the same principle with the last #Bitcoin cycle you get almost the exact same outcome. Only difference is Bitcoin usually tops at the first of December and not January.

The 4 Year Bowl is identical with Ethereum and Bitcoin
When you lay them side by side you get a pretty insane correlation. The fact $ETH accumulated for 2 years at that range low makes me feel as if the parabolic rise will happen faster than everyone thought.

Look how identical it is to the last $BTC cycle. Who could argue against?
S/O to @BobLoukas for teaching me how cycles work. I was one of the first members on @BitcoinLive1 and Bob was the only person I listened to. True Legend.

So... How does "4 Year Cycle Theory" work?

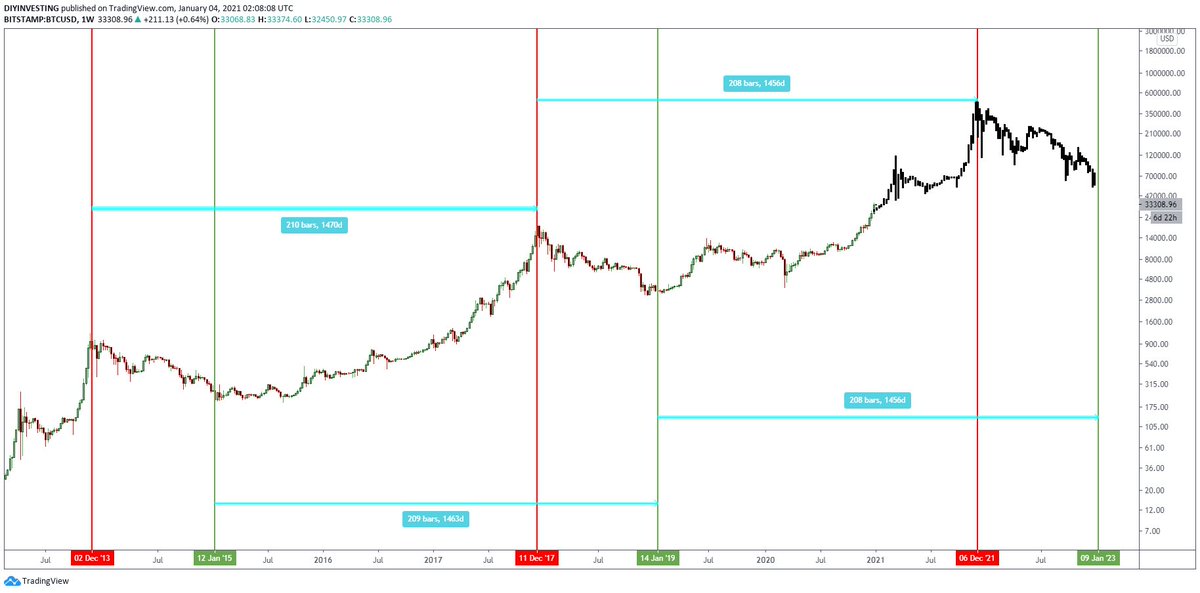
Measure from peak low to peak low. Each cycle equals 4 years in distance.
We can see that 2015 was the cycle low in Bitcoins last cycle. Measure 4 years in advance and that takes us to almost the exact cycle bottom at $3,200.

You can take the same principle and apply it to peak high to peak high as well. It also equals almost exactly 4 years time.
4 Year Cycle Theory can also be used to map out the top of the next cycle.

From peak low to peak low 4 years comes out to January 2023 being the bottom

Peak high to peak high comes out to a cycle top the beginning of 2022.
Apply the same rules to the current #Ethereum cycle and you get something like this...

I have been talking about a $20k $ETH for months now and that's more than reasonable. In fact, we could even overshoot this.

90% of #Crypto NEEDS Ethereum. It's the digital oil of Crypto.
So, now you guys understand my thoughts on why this will be the biggest bull run in #Crypto History. Institutions, on ramps, DeFi, and retail like we have never seen before. Combine that with mass inflation and you get a true explosion. Are you ready?
YouTube video will be out covering this analysis in about an hour or so! For the people that want me to break it down in an easy to understand way. This is one you don't want to miss out on :)

More from Crypto

You may be wondering why @bristoliver rather cryptically RT’d a chart that I posted last night. The answer is not just that he loves quadratic fits on log axes, but that this chart may –and I stress may– hint at a vaccine effect amongst the over 80s THREAD


WARNING: this is a long thread, and it’s a bit of a roller-coaster. We find some apparently strong patterns in the data, and then start to unpick them a bit. So if you start getting excited half way through you might find you’re less excited at the end. But we’ll see…

First we first have to go back a bit. @bristoliver posted a thread a few days ago explaining why, with a constant vaccination rate, a log plot of cases should show a quadratic form. In other words, it should fit an equation like: a + b.x + c.x^2

I meant to link in the model thread there - here it is


the quadratic coefficient – the ‘c’ in that equation – gives an estimate of the % of the population who are being newly protected by the vaccine each day. Please note ‘protected by the vaccine’, not ‘vaccinated’ – as we don't expect 100% protection after the first dose

You May Also Like

12 TRADING SETUPS which experts are using.

These setups I found from the following 4 accounts:

1. @Pathik_Trader
2. @sourabhsiso19
3. @ITRADE191
4. @DillikiBiili

Share for the benefit of everyone.

Here are the setups from @Pathik_Trader Sir first.

1. Open Drive (Intraday Setup explained)


Bactesting results of Open Drive


2. Two Price Action setups to get good long side trade for intraday.

1. PDC Acts as Support
2. PDH Acts as


Example of PDC/PDH Setup given
Ivor Cummins has been wrong (or lying) almost entirely throughout this pandemic and got paid handsomly for it.

He has been wrong (or lying) so often that it will be nearly impossible for me to track every grift, lie, deceit, manipulation he has pulled. I will use...


... other sources who have been trying to shine on light on this grifter (as I have tried to do, time and again:


Example #1: "Still not seeing Sweden signal versus Denmark really"... There it was (Images attached).
19 to 80 is an over 300% difference.

Tweet: https://t.co/36FnYnsRT9


Example #2 - "Yes, I'm comparing the Noridcs / No, you cannot compare the Nordics."

I wonder why...

Tweets: https://t.co/XLfoX4rpck / https://t.co/vjE1ctLU5x


Example #3 - "I'm only looking at what makes the data fit in my favour" a.k.a moving the goalposts.

Tweets: https://t.co/vcDpTu3qyj / https://t.co/CA3N6hC2Lq