2/ The P/S ratio is an ideal valuation method for early-stage protocols, which often have little or no net income.
Instead, the P/S ratio focuses on the usage of a protocol, by tracking the total fees paid (revenue) by the users of its service. More info:
https://t.co/XlHI7XPTvI
3/ We’re in a historically unique position, with early-stage & high-growth startups operating transparently on-chain.
This transparency makes it possible to find protocols with high usage relative to market cap.
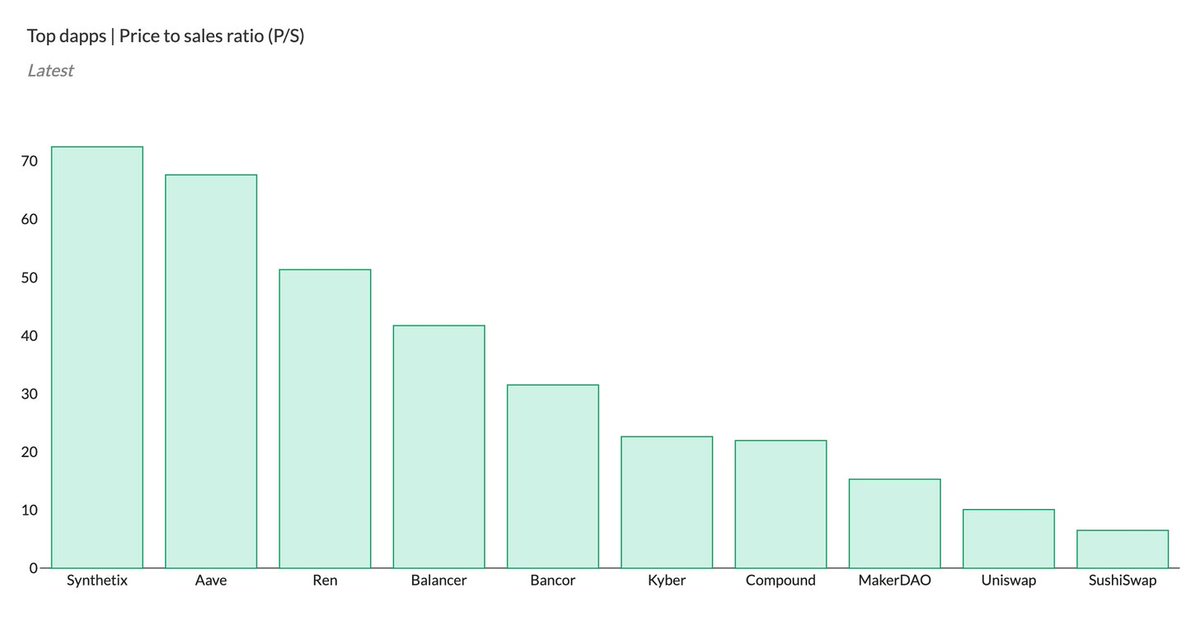
4/ Top dapps from Token Terminal sorted based on the price to sales (P/S) ratio.
Note: Maker has gone from a high P/S ratio to #3 in a matter of months after raising the stability fees for DAI.
Also, two currently similar AMMs (Uniswap & SushiSwap) have the lowest P/S ratios.
5/ Let's look at the P/S ratios from a historical perspective.
The P/S ratio is calculated by dividing a project’s fully-diluted market cap by its annualized revenues.
The metric itself does not tell us about the growth patterns in a protocol’s market cap or revenues.
6/ Uniswap’s historical price to sales (P/S) ratio (right Y-axis) and market cap (left Y-axis).
There seems to be a pretty direct correlation between the (low) P/S ratio & market cap --> revenues have been consistently high since the launch of the $UNI token.
7/ Uniswap’s historical price to sales (P/S) ratio (right Y-axis) and daily total revenue (left Y-axis).
Uniswap’s daily revenues have been consistently high during Q3-Q4 --> fluctuations in market cap have been the primary driver for changes in the P/S ratio.
8/ Sushiswap’s historical price to sales (P/S) ratio (right Y-axis) and market cap (left Y-axis).
There does not seem to be a direct correlation between the (low) P/S ratio and market cap.
9/ Sushiswap’s historical price to sales (P/S) ratio (right Y-axis) and daily total revenue (left Y-axis).
Surges in Sushiswap’s daily revenues have trended its P/S ratio lower both during its launch and also more recently.
10/ Compound’s historical price to sales (P/S) ratio (right Y-axis) and market cap (left Y-axis).
Compound’s market cap has been stable since the launch of $COMP. Its P/S ratio trended quickly to a low double-digit figure --> revenues spiked after the launch of its token.
11/ Compound’s historical price to sales (P/S) ratio (right Y-axis) and daily total revenue (left Y-axis).
Compound’s daily revenues spiked up significantly with the launch of the $COMP token and associated liquidity mining.
12/ Kyber’s historical price to sales (P/S) ratio (right Y-axis) and market cap (left Y-axis).
There seems to have been a pretty direct correlation between the P/S ratio & market cap during the early days --> revenues were low initially, but have been on an upward trend since.
13/ Kyber’s historical price to sales (P/S) ratio (right Y-axis) and daily total revenue (left Y-axis).
Kyber’s daily revenues were relatively low in the beginning but have been on an upward trend for the past two years.
14/ Synthetix’s historical price to sales (P/S) ratio (right Y-axis) and market cap (left Y-axis).
After the launch of Synthetix v2, the protocol had a relatively low market cap & high P/S ratio --> revenues were low initially, but have trended upward during the past quarter.
15/ Synthetix’s historical price to sales (P/S) ratio (right Y-axis) and daily total revenue (left Y-axis).
Synthetix’s daily revenues have been been on an upward trend during Q3-Q4, after a slower start in Q2.
16/ Ethereum’s historical price to sales (P/S) ratio (right Y-axis) and market cap (left Y-axis).
Market cap of Ethereum is a long way from the highs of 2017, yet its P/S ratio is on par with leading DeFi protocols --> significant growth in revenues during the past 6 months.
17/ Ethereum’s historical price to sales (P/S) ratio (right Y-axis) and daily total revenue (left Y-axis).
Ethereum’s daily revenues have been consistently high during Q2-Q4, while its market cap has yet to catch-up with the growth of the Ethereum ecosystem.
18/ The performance of Token Terminal’s price to sales ratio-weighted index.
It’s one of the first fundamentals-based indexes in the crypto market.
Source:
https://t.co/ZeVImRsVAa
19/ The historical composition of the TTI index.
It shows that Compound, Uniswap, and MakerDAO currently hold the largest weightings in the index portfolio.
20/ We recently posted a proposal for the TTI to be included in the
@indexcoop product offering — you can view the proposal here:
https://t.co/JzYpuFE0yY
fin/ Check out our newsletter for more DeFi-related insights:
https://t.co/PBMFHQnx1o